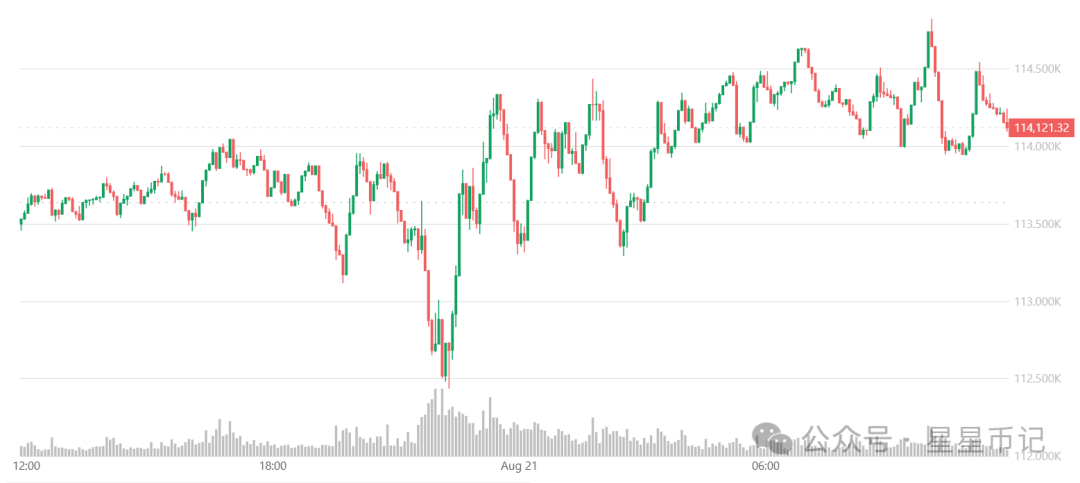
On Thursday (August 21), Bitcoin stabilized around $114,610 in Asian markets, regaining some of the losses from last week, while Ethereum performed even better, surging 5.8% to $4,370.73, as investors engaged in selective rotation within the market.
Altcoins are showing unusual resilience, with Bitcoin's dominance nearing a six-month low. The CoinDesk 20 index, which represents the largest crypto assets, rose 3.5%, trading above 4,078 points.
The Fed minutes once pressured Bitcoin
Yesterday, Bitcoin and Ethereum briefly declined but regained strength within an hour after the Federal Reserve released the minutes from the July monetary policy meeting. The minutes revealed that the two governors who voiced dissent at the Federal Open Market Committee (FOMC) failed to convince other members to support their position.
Minutes disclose: 'A few members wanted to lower the federal funds rate target range by 25 basis points at this meeting. These members believe that excluding tariff factors, inflation is close to the committee's 2% target, and higher tariffs are unlikely to have a lasting impact on inflation.'
Federal Reserve governor Christopher Waller and current Vice Chair (Supervision) Michelle Bowman have been signaling support for an early interest rate cut. Rate cuts typically release capital, thereby boosting the crypto market.
Since 1993, there has not been a case of two governors dissenting simultaneously. The last time a governor voiced dissent individually was in September 2024, when Bowman favored a 25 basis point cut, rather than the 50 basis points ultimately decided by the Fed.
While many traders will be watching Fed Chair Powell's speech at the Jackson Hole central bank conference on Friday, the minutes have provided a 'temperature check' on the governors' viewpoints.
Meanwhile, U.S. President Donald Trump continues to pressure the Federal Reserve to cut rates, including threatening to fire Fed Chair Powell, although he has yet to take action.
Federal Reserve policy remains the biggest uncertainty for the market. The market is holding its breath for Powell's speech at Jackson Hole, concerned that a hawkish stance will draw liquidity away from speculative assets.
After a record-breaking July, Bitcoin weakened in August, mirroring the stagnation of the Nasdaq and S&P 500 under interest rate pressure. Institutional ETFs were not spared: over August 18-19, more than $1 billion flowed out, coinciding perfectly with the timing of the bond market's repricing of rate cut expectations. The message is clear—crypto ETFs are now closely tied to Wall Street's liquidity cycle, not merely reliant on on-chain activity.
Rotation of funds between Bitcoin and Ethereum
Bitcoin hovers above $114,000, but its support is becoming increasingly fragile as ETF fund flows send mixed signals. In July, Bitcoin ETFs recorded net inflows of $6.02 billion, but in August, it took a sharp downturn, now showing a net outflow of $139.5 million.
A notable feature of 2025 is the rotation of funds between Ethereum and Bitcoin ETFs. In the week ending August 15, U.S. spot Ethereum ETFs astonishingly recorded $2.85 billion in inflows, nearly double Bitcoin's $548 million. This pushed ETH above $4,000, nearing its all-time high. However, the situation reversed within days: on August 18-19, ETH ETFs saw outflows of $422.2 million in a single day, while Bitcoin saw outflows of $523.3 million.
OKX Singapore CEO Gracie Lin stated in a note to CoinDesk that the rising ETH/BTC ratio indicates capital is shifting towards the relative strength of Ethereum, while Bitcoin is in a consolidation phase.
"Crypto capital is becoming more selective," Lin told CoinDesk. She emphasized that this is not a comprehensive 'altcoin season,' but a targeted flow of funds towards ETH, with macro factors such as the Jackson Hole central bank conference and upcoming U.S. inflation data becoming catalysts.
Latest data from CryptoQuant explains why Bitcoin's upward momentum has cooled. The report states that apparent demand has dropped from 174,000 BTC in July to 59,000 BTC today, while ETF inflows have fallen to their weakest level since April.
Profit-taking remains heavy, with 'whales' realizing $2 billion in profits on August 16 alone, bringing total profits realized since July to $74 billion. CryptoQuant analysts now classify the market as being in a 'cooling bull market' phase, with $110,000 seen as an important support level.
Analysts from Singapore-based market maker Enflux noted in a statement to CoinDesk that retail enthusiasm for the 'altcoin season' has significantly declined compared to last week, although strategic bets like BNB reaching an all-time high and Hyperliquid's operational strength are still attracting capital.
"This indicates that the altcoin market is no longer a single holistic trade, as macro confidence gradually forms, capital becomes more selective and concentrated, including on the institutional side," the company stated.
As a result, the market is no longer primarily driven by broad increases but by a few winners, with Ethereum setting the tone—capital remains in the crypto market, but flows are becoming more focused, favoring resilience over speculation.
Bitcoin Technical Analysis
Despite the unprecedented scale of ETF configurations—U.S. spot Bitcoin ETFs controlling a total of $146.2 billion, equivalent to 6.47% of Bitcoin's market cap—the price performance remains weak. BTC has repeatedly failed to reclaim the $117,500 resistance, with the 50-day moving average at $116,033 acting as a ceiling. On August 20, BTC trading volume shrank to $10.8 billion, further reinforcing the bearish trend.
Analysts emphasize that key support levels are at $111,982 and $110,053, with a potential 'liquidity protective wall' around $105,000, where large buy orders are lurking. The RSI and MACD indicators remain bearish, suggesting that if the capital flow does not stabilize, there is still room for decline.
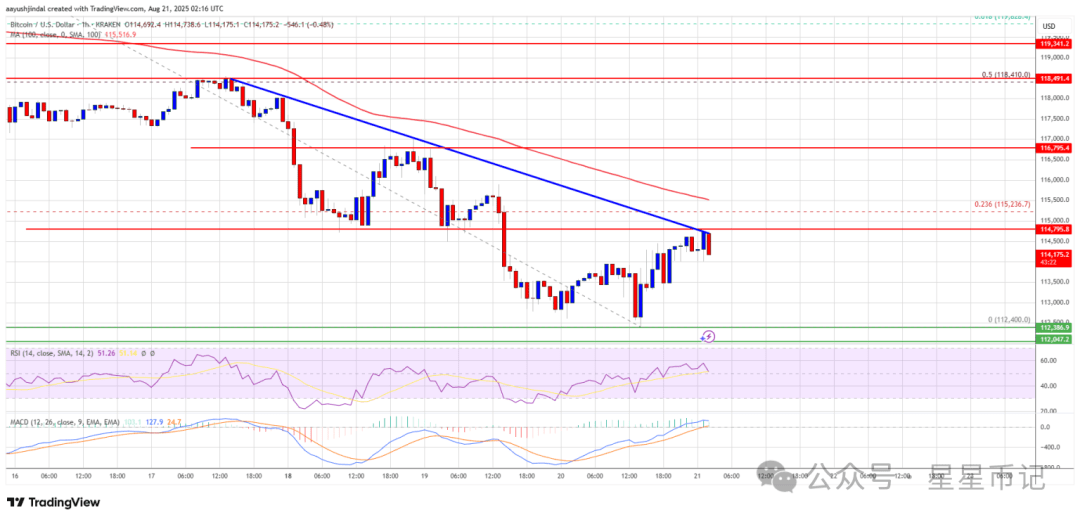
Bitcoin's price began a new round of declines after closing below the $115,500 level. BTC gained downward momentum and fell below the $113,500 support area. The price further broke below the $113,000 support area and the 100-hour moving average, testing the $112,500 region. It reached a low of $112,400, and the current price is attempting a rebound, targeting the 23.6% Fibonacci retracement level of the drop from $124,420 high to $112,400 low.
Bitcoin is currently trading below $115,000 and below the 100-hour simple moving average. Immediate resistance is near $114,800. A key descending trendline has also formed on the BTC/USD hourly chart, with resistance around $114,800. The first key resistance level is $115,000. The next resistance may be at $115,500. If it can close above the $115,500 resistance, the price may rise further. In this case, the price is expected to rise and test the $118,400 resistance level, which is close to the 50% Fibonacci retracement level of the drop from $124,420 high to $112,400 low. If it continues to rise, the price may approach $120,000, with a major target potentially being $121,500.
If Bitcoin fails to break through the $115,000 resistance area, it may initiate a new round of declines. Immediate support is at $113,500. The first major support level is around $112,400. The next support level is in the $111,500 area. If further losses occur, the price could drop toward $110,000 in the short term. Major support is near $108,000, and if this level is breached, BTC may face significant setbacks.
Technical Indicators:
Hourly MACD: The MACD is currently losing momentum in the bearish zone.
Hourly RSI (Relative Strength Index): The RSI for BTC/USD is currently above the 50 level.
Major support levels: $113,500, followed by $111,500.
Major resistance levels: $115,000, followed by $115,500.


