In summary
OKB soared 85% in one week, reaching a historic high of $195 after a 93% reduction in token supply through burn.
The Aroon Up line reached 100% and the Chaikin money flow hit a three-month high, confirming strong bullish momentum.
The RSI of 92.66 indicates that the asset is overbought and may pull back to $142.88.

The cryptocurrency market has rebounded today, with the global cryptocurrency market capitalization slightly recovering after several days of decline. Leading the charge is the native token OKB from the cryptocurrency exchange OKX.
OKB surged over 51% in the past 24 hours, hitting a historic high of $195 earlier today. Although the trading price of OKB has slightly decreased to around $194.07 as of the time of writing, key indicators still show strong bullish signals. This increases the likelihood of OKB retesting and breaking through new highs.
The upward momentum of OKB is enhanced by the token burn.
OKB is one of the best-performing crypto assets over the past week. In the last seven days, its price surged nearly 85%. Prior to this price surge, OKB underwent a large-scale token burn, resulting in a 93% reduction in its circulating supply.
This significant reduction in holdings has stimulated investor demand. Technical indicators show that if this trend continues, OKB is likely to experience sustained growth. For example, as of the time of writing, the Aroon line for OKB has reached 100%, indicating a strong upward trend supported by substantial capital.
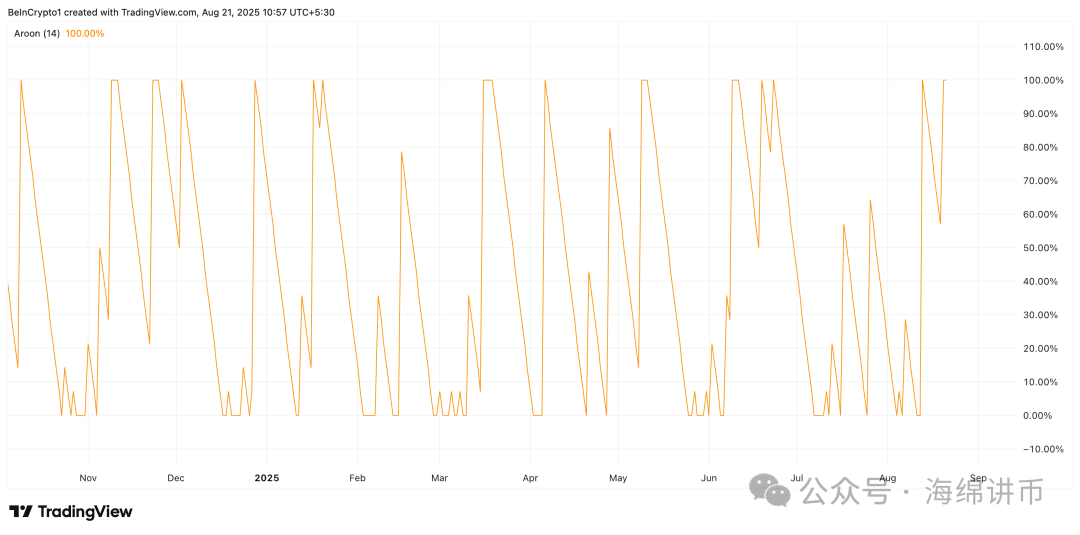
The Aroon indicator of an asset measures the strength and direction of a trend by tracking the time since the highest and lowest prices over a specific period. The indicator consists of two lines: Aroon Up to measure bullish activity; Aroon Down to track bearish pressure.
Similar to OKB, when the Aroon Up line is at 100%, the asset has recently reached a new high, signaling a dominant bullish trend. This indicates strong buying pressure, and the token price may continue to rise.
Additionally, the Chaikin Money Flow (CMF) indicator for OKB is above the zero line and is trending upward as of the time of writing, confirming the inflow of liquidity. This key momentum indicator measuring the flow of funds in and out of the market is currently at a three-month high of 0.24.
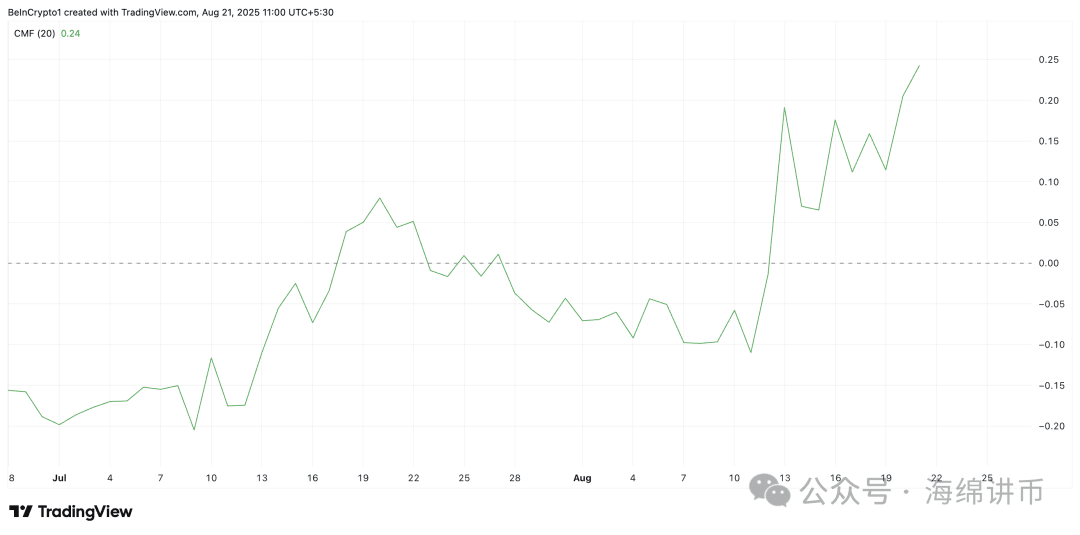
The positive value of the CMF indicates strong buying pressure and sustained capital inflow. This means that OKB holders are accumulating this altcoin, driving its price further up.
OKB has climbed to an all-time high, but overbought signals are raising red flags.
Considering these key indicators, the price of OKB may have further room for growth. If demand continues, OKB may retest its historical high and attempt to break through this level.
However, caution is advised. The relative strength index (RSI) of the token indicates that the asset is currently in the overbought zone, which means there is a risk of a short-term pullback if signs of buyer fatigue appear. As of the time of writing, this index stands at 92.66.
The RSI indicator measures the overbought and oversold market conditions of an asset. Its value ranges from 0 to 100. A value above 70 indicates that the asset is overbought and the price is likely to decline; a value below 30 indicates that the asset is oversold and the price may rebound.
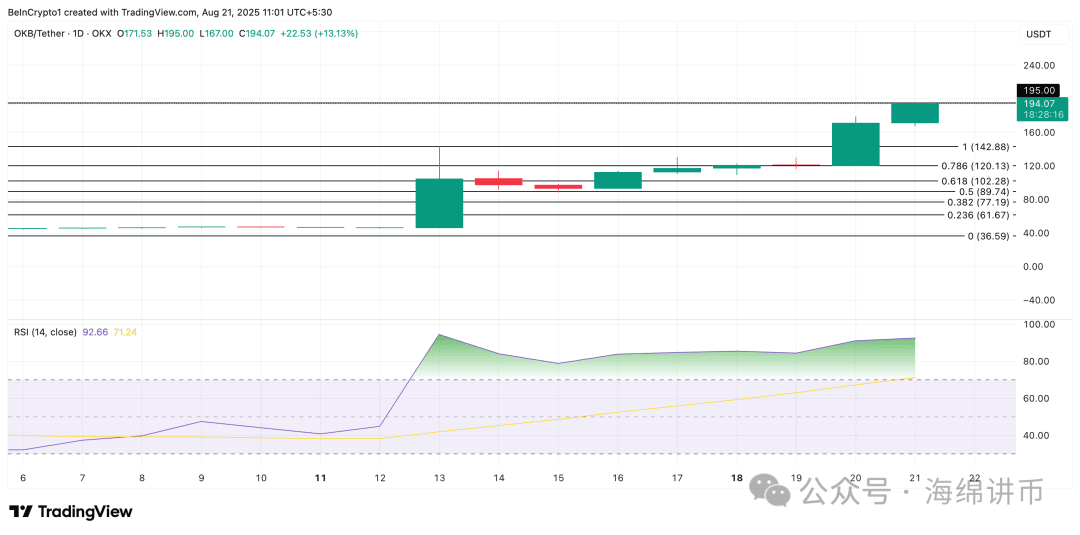
The RSI for OKB is 92.66, indicating a potential pullback in the short term. If this occurs, the price of this altcoin may drop to $142.88.