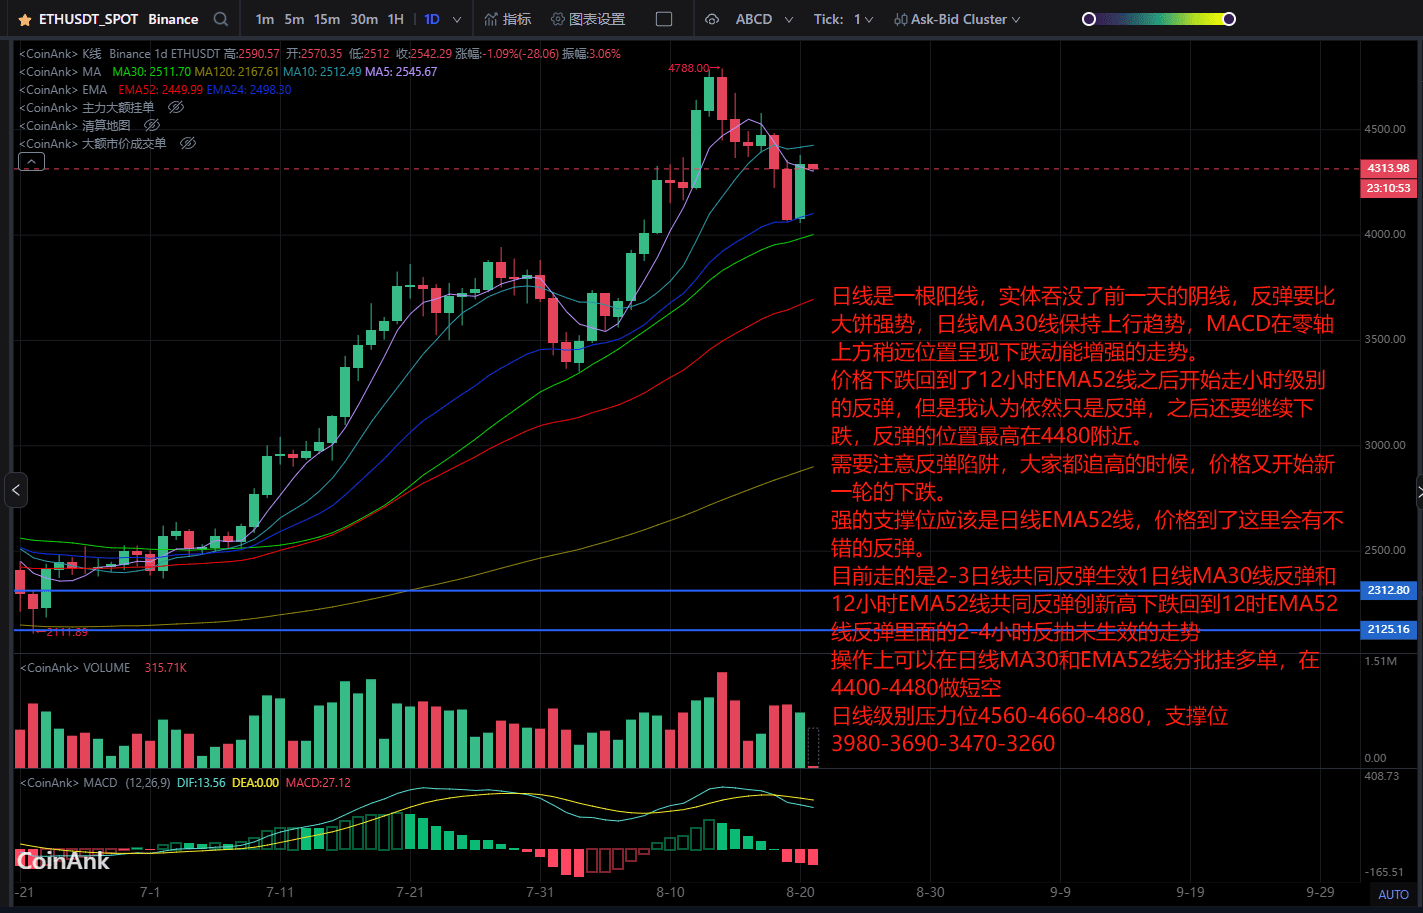
The daily line is a bullish candle, its body engulfs the previous day's bearish candle. The rebound is stronger than Bitcoin, the daily MA30 line maintains an upward trend, and the MACD shows an increasing downward momentum slightly above the zero axis.
The price dropped back to the 12-hour EMA52 line and then started to rebound at the hourly level. However, I still believe it is just a rebound, and there will be further declines afterward, with the highest rebound position around 4480.
Be cautious of rebound traps; when everyone is chasing highs, the price will start a new round of decline.
The strong support level should be the daily EMA52 line; the price will have a nice rebound when it reaches here.
Currently, it is a 2-3 day joint rebound effect, with the 1-day MA30 line rebound and the 12-hour EMA52 line joint rebound reaching new highs and then falling back to the 12-hour EMA52 line, where the 2-4 hour pullback has not yet been effective.
In terms of operation, you can place buy orders in batches at the daily MA30 and EMA52 lines, and make short positions at 4400-4480.
Daily level resistance at 4560-4660-4880, support at 3980-3690-3470-3260.