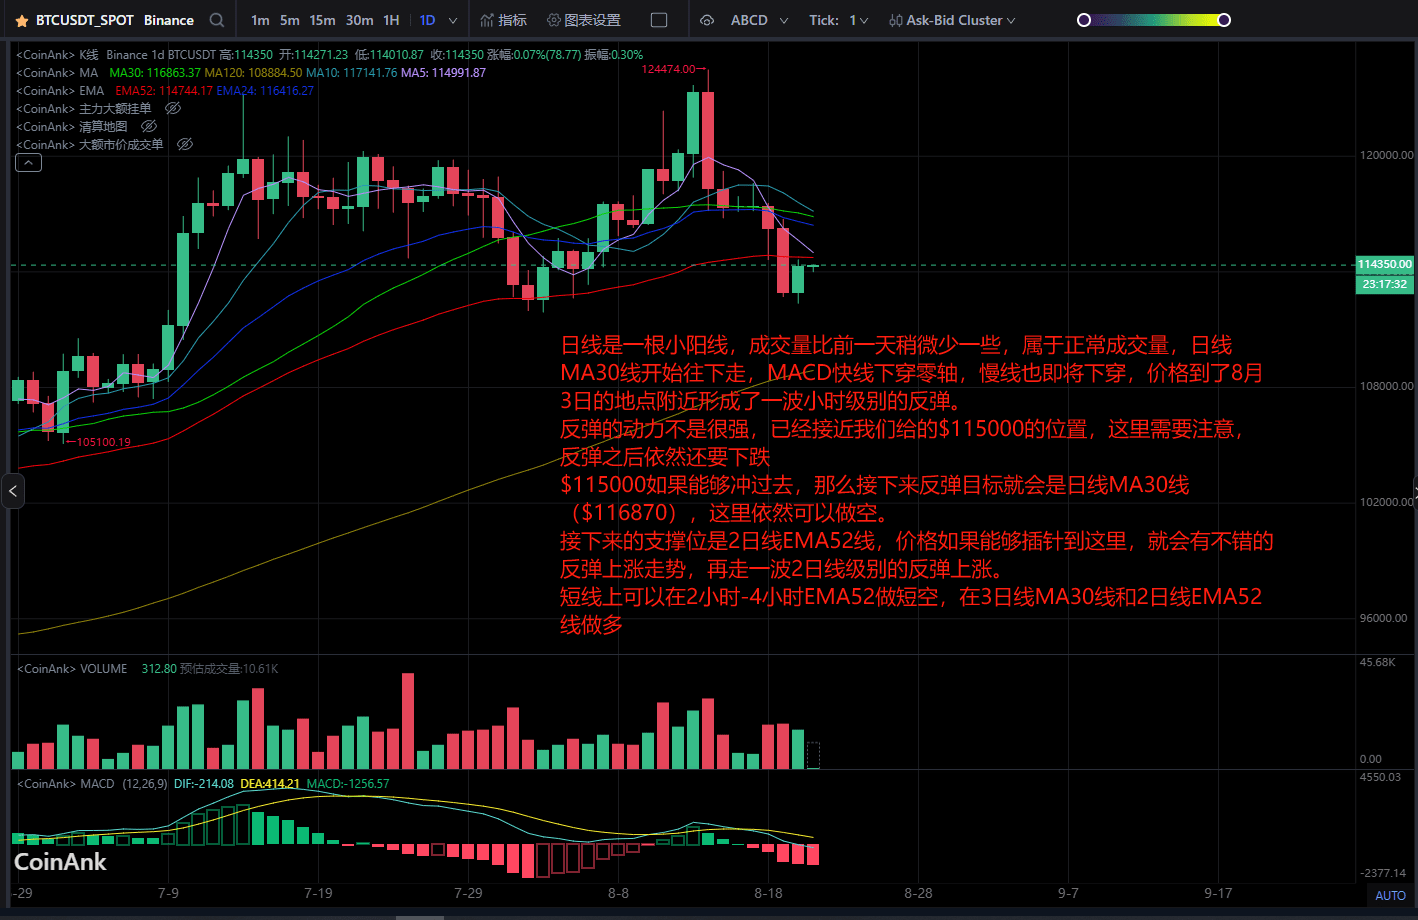
The daily line is a small bullish candle, with trading volume slightly lower than the previous day, which is normal trading volume. The daily MA30 line starts to decline, the MACD fast line crosses below the zero axis, and the slow line is also about to cross below. The price has formed a wave of hourly level rebound near the location of August 3.
The strength of the rebound is not very strong, and it is already close to the $115000 position we provided. It is necessary to pay attention here; after the rebound, there will still be a decline.
$115000, if it can break through, then the next rebound target will be the daily MA30 line ($116870), where you can still go short.
The next support level is the 2-day EMA52 line. If the price can spike to this level, there will be a good rebound upward trend, followed by another wave of rebounds at the 2-day level.
In the short term, you can go short at the 2-hour to 4-hour EMA52, and go long at the 3-day MA30 line and the 2-day EMA52 line.