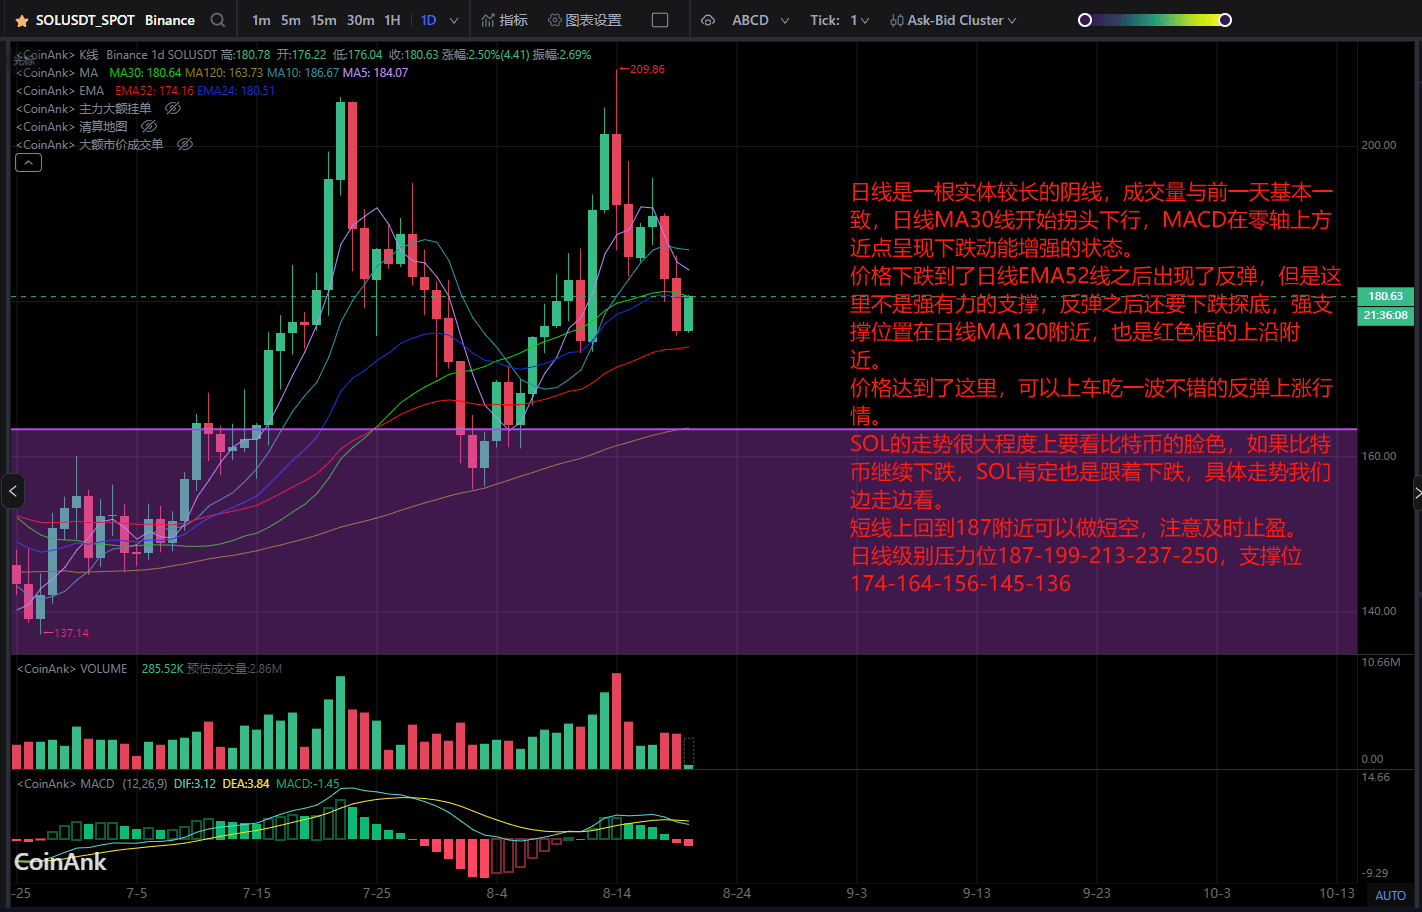
The daily chart shows a long bearish candlestick, with trading volume nearly consistent with the previous day. The daily MA 30 line is starting to turn downward, and the MACD is showing increasing bearish momentum above the zero axis.
The price dropped to the daily EMA 52 line and then rebounded, but this is not a strong support level. After the rebound, it is expected to decline further to find a bottom. Strong support is located near the daily MA 120 line, which is also near the upper edge of the red box.
The price has reached this level, and you can jump in for a nice rebound rally.
The trend of SOL largely depends on the performance of Bitcoin. If Bitcoin continues to decline, SOL will definitely follow suit. We will observe the specific trend as we go.
In the short term, if it returns to around 187, you can consider a short position, but be sure to take profits in time.
Daily level resistance levels are 187-199-213-237-250, and support levels are 174-164-156-145-136.