On 25/08/20, the US stock index experienced a plunge, BTC is waiting for significant volume spikes, and Ethereum maintains a downward channel.
The US stock index continues to decline, with the Nasdaq dropping 1.63% as soon as it opened today and the S&P 500 down 0.89%. The Dow Jones index has been fluctuating near previous highs without breaking through. Currently, it can also be seen that it has dropped back down. The Nasdaq and S&P 500 have fallen in two days by the amount gained in the previous week. Before the clear interest rate cut in September, it cannot be ruled out that there will be support near the low of August 1.
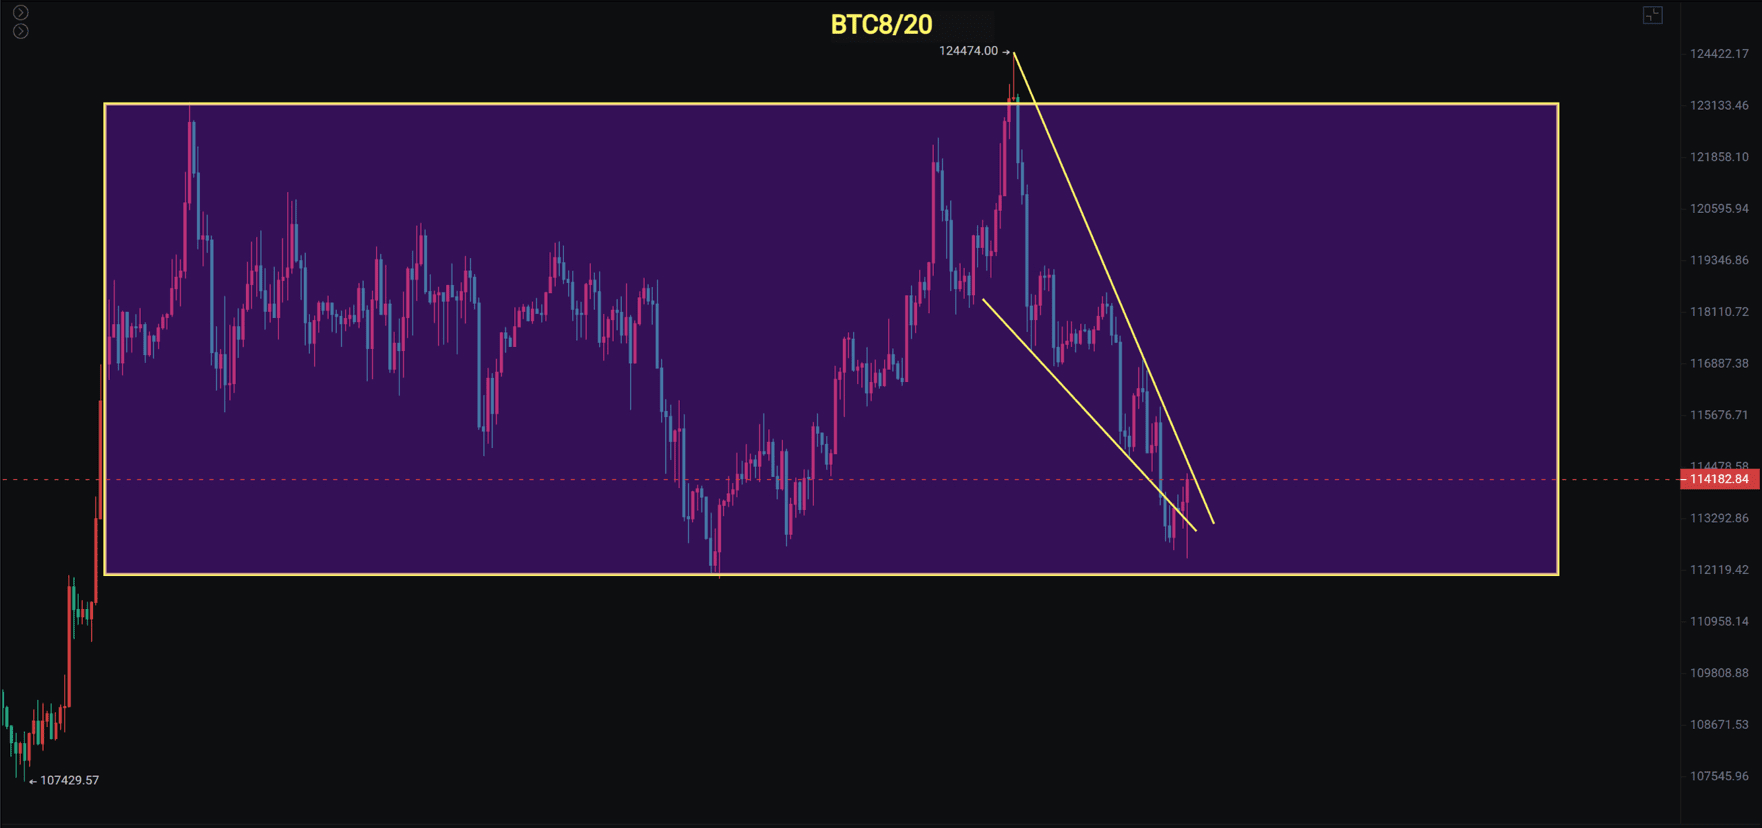
The US dollar index has been fluctuating between 98 and 99. From this perspective, it is also waiting for the overall interest rate cut to land. London gold has been fluctuating at a high level for four months. Whether there will be an interest rate cut in September is very critical. Bitcoin's CME gap at 114271 has been filled and has dropped back, temporarily testing the support near 119000. If it breaks further down, there is a gap near 108000. In the short term, Bitcoin dropped to a low of 112300 with a spike, showing a short-term rebound.
Bitcoin
Bitcoin has been continuously declining for a week and has reached the previous support level around 112000, which offers short-term support. However, whether it can rebound depends on the strength of the rebound. Additionally, the continuous decline in the US stock market over the past two days will also impact Bitcoin. A rebound on the left side cannot break below 119000. If a large bearish candle breaks below 119000, it is still necessary to exit the market.
The upward trend of Bitcoin on the daily line has broken, and it is currently testing the support near the previous high of 119000. Pay attention to the short-term false breakdown opportunities if it breaks and then retests. However, at present, the decline does not show significant volume. The MACD has crossed below the zero line, and four days of adjustment is not enough. Based on the previous upward time cycle, which lasted about two weeks, there will be a significant rebound opportunity at the end of this month and the beginning of next month.
Support: 108000 to 100000
Resistance: 116000 to 118500 to 121000
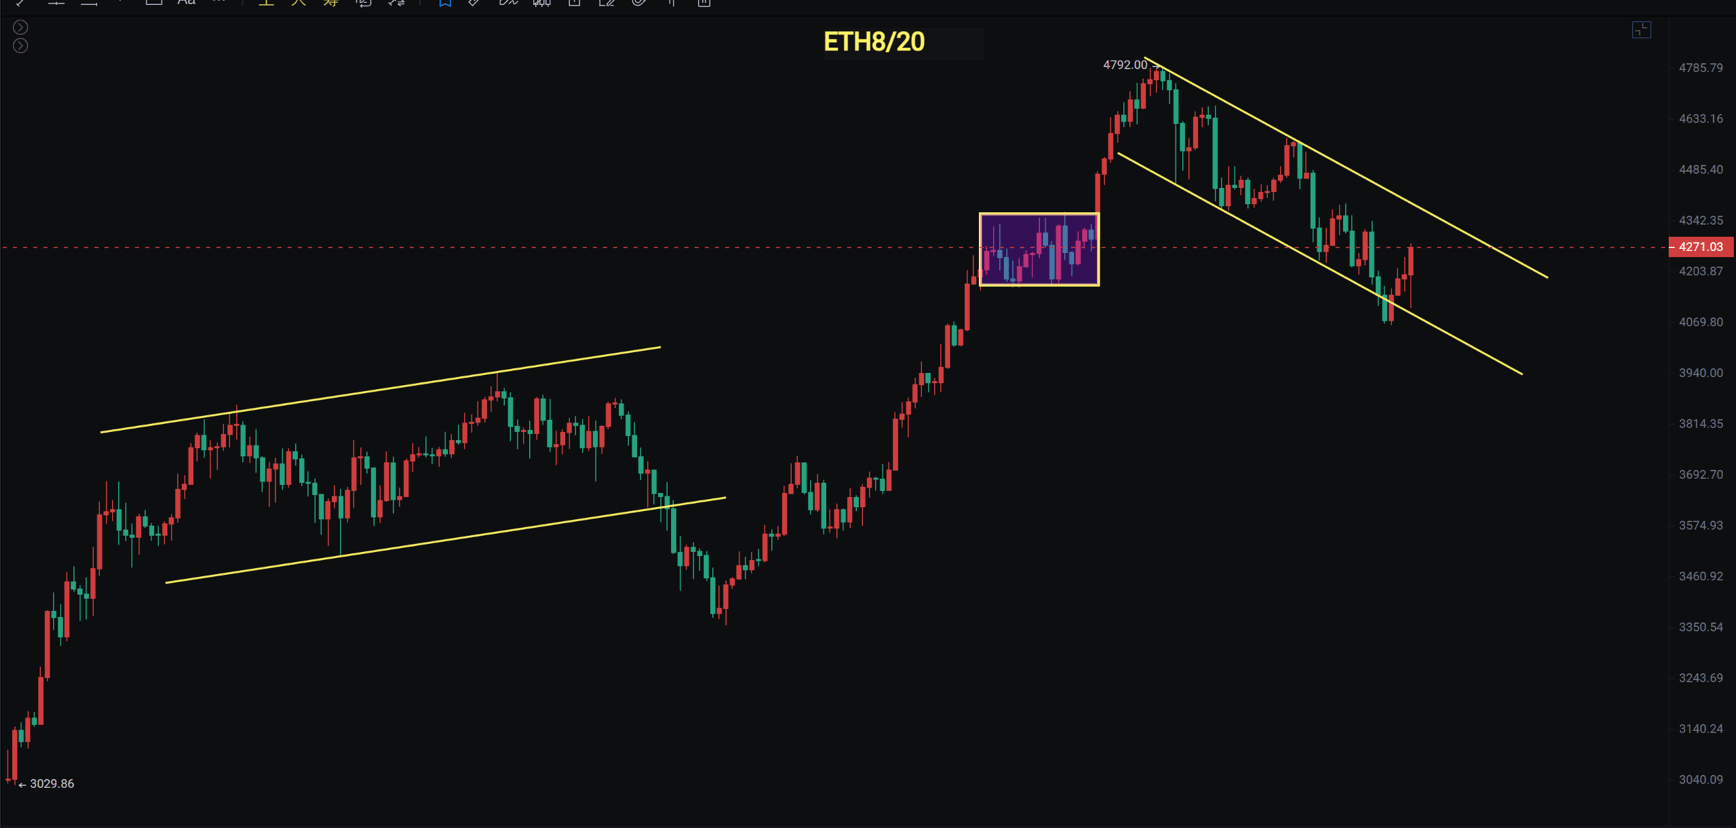
Ethereum
Ethereum dropped to a low of 4060, breaking below the downward channel. The US stock market opened lower as well, followed by a spike rebound pressure at 4360. The daily line drop touched the 20 moving average which provides short-term support, but the decline did not show significant volume. The MACD histogram crossed below the zero line, and the fast and slow lines intersected. Ethereum is slightly stronger than Bitcoin, with the upward trend line still being tested. Therefore, we should also observe whether the support around 119000 for Bitcoin is effective.
The 4-hour chart maintains a downward channel and is currently testing the support of the previously broken platform. If Bitcoin breaks below the support of 119000, given that the US stock market is also correcting, it will continue to decline. During the day, Bitcoin prompts left-side entry for a short-term rebound, and we need to wait for clearer entry signals on the right side.
Support: 3800 to 3950
Resistance: 4360 to 4660