Bitcoin's lowest price yesterday was slightly above 112,000, very close to the support zone below. The daily chart shows signs of accelerated decline, and the short-term bottom should be approaching, perhaps within the next couple of days? This week's data will include a report and a speech on Friday.
However, there is currently no clear bottom formation, which is similar to my view on Ethereum. The last low was 112,000, and now it is slightly above 112,000. I believe it is likely to drop below this position quickly. If a long lower shadow appears with increased volume, I will enter the market.
BTC Technical Analysis
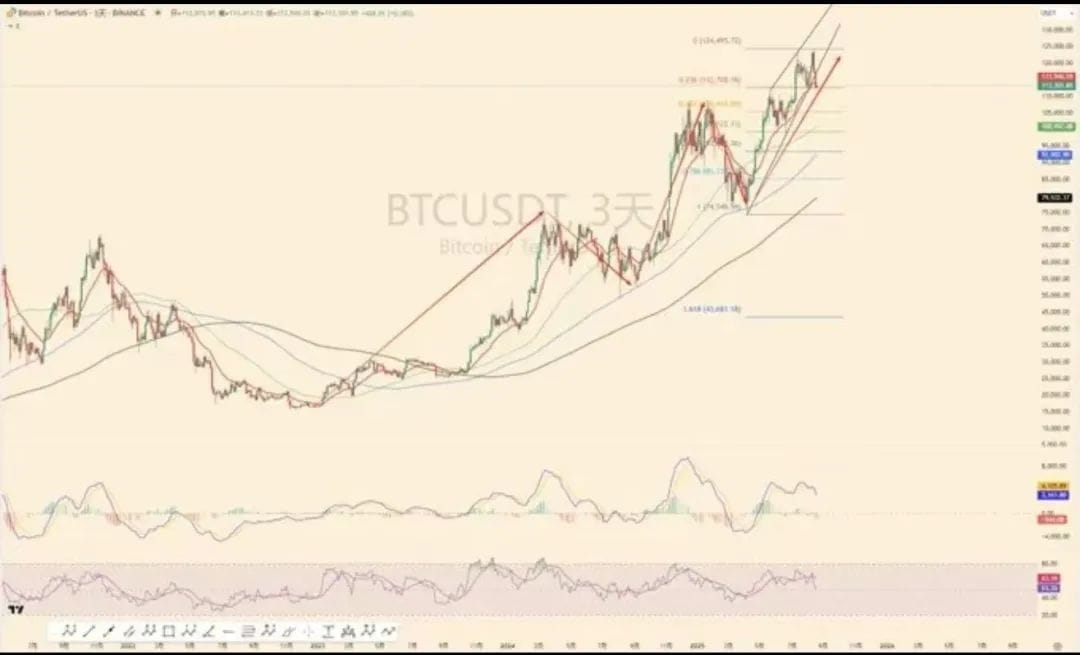
The rise starting from 111920 is the last segment of the overall rise that began from 74508; the current decline is approaching the last bit of this rise, and the level may have expanded to the pullback targeting the rise from 74508 to 124474.
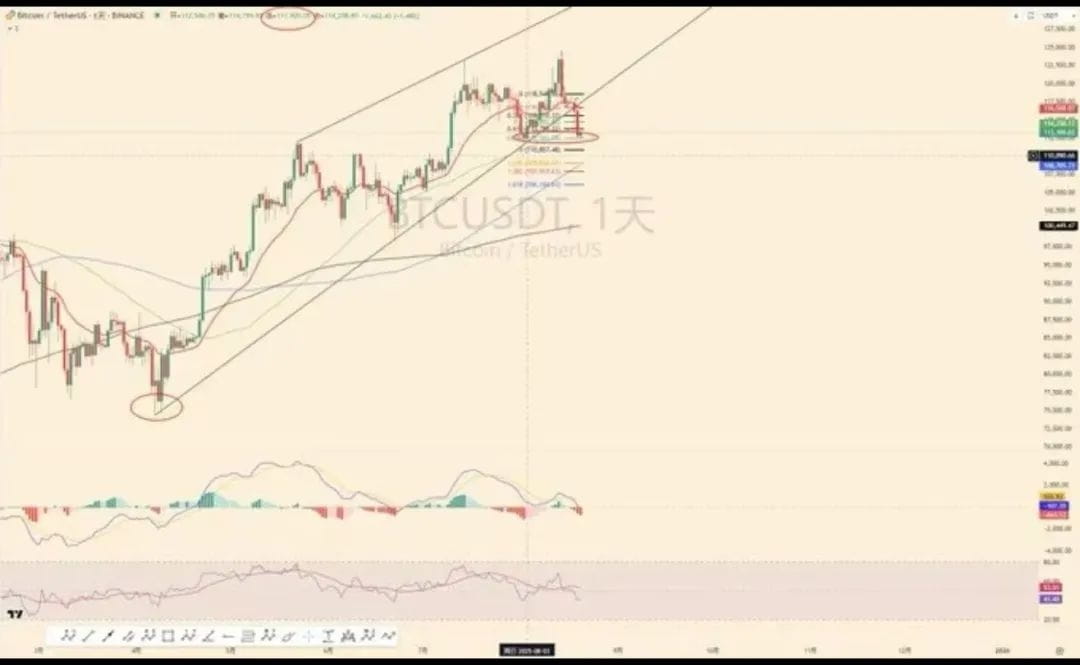
The rise from 74508 to 124474 may be the fifth segment of the overall rise that started from 15476; therefore, let's first assume a few key supportive levels and observe the price performance afterwards, from near to far: 112000 (the starting point of the last rise), 108706 (today's price, daily MA120), 92503 (today's price, 3-day MA120), 74508 (the starting point of the ending diagonal).
Indicators: The daily indicator for Bitcoin is neutral, bearish below the daily level, while the higher levels are in the correction process from a high (overbought); it is particularly important to note that if the daily bullishness continues to weaken, the weekly MACD will form a dead cross. The larger indicators have relatively high certainty, and if the weekly dead cross is confirmed, it will either be a long-term correction (2024-03 to 2024-08) or a violent drop (2025-01 to 2025-04).
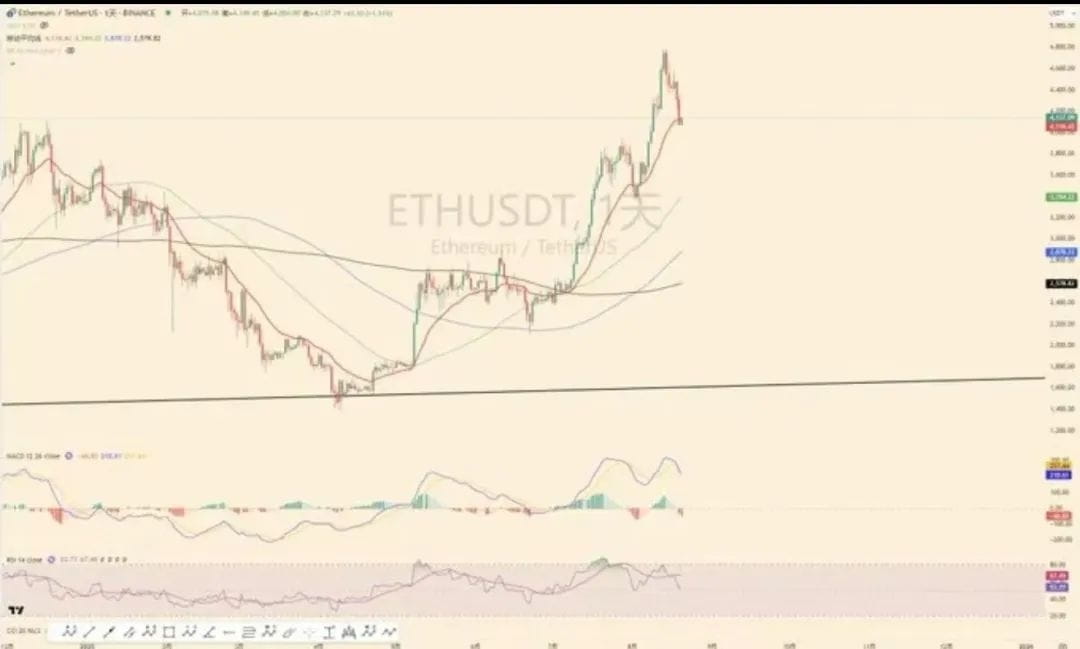
ETH Technical Analysis
Ecoin represents this overall trend starting from April 8, both in terms of the rise and market sentiment; Ecoin has replaced Bitcoin's position in this round. The rise that started from 3354 can be seen as wave 3 of wave 5 or wave 5 of the rise starting from 1300 (uncertain).
Currently, the daily indicators are in a correction phase, with MACD not returning to the zero axis; larger indicators lag behind Bitcoin, so it is still better to follow the market. When the market is good, it will outperform, but if the market declines, it cannot hold up alone.
Altcoin
Altcoins can lay out quality leaders at lower prices; the logic has not changed. Only quality leading altcoins will follow the market's rise; others are currently trash. There will not be another 'altcoin season'; the so-called applications in the crypto world are merely 'playing around' in the eyes of traditional capital. They only need to shell the blockchain to take away the project team's livelihood; Circle is the best example.
One can consider lightly purchasing on dips to speculate on a 'short squeeze rebound,' but avoid bottom-fishing or clinging to battles—currently, institutions are heavily manipulating the market, and it is unclear when the next big moves will occur; focus on swing trading.
SOL Ecosystem
JTO / JUP (Established with good liquidity, can buy on pullbacks with 'T')
AI Calculation
FET / RNDR (The narrative is not dead, small positions for sudden drops)
Ethereum Ecosystem
L2 Mainstream (OP / ARB) and Established DeFi (UNI) Trading Rhythm Principles: Mainstream first, altcoins later; leaders first, followers later; lighter positions.
DOGE
Dogecoin's key support is at 0.21-0.20, showing excellent performance in previous trends. Strategy: Buy at around 0.20 and hold for appreciation.
PEPE
PEPE's recent sharp decline is accompanied by a decrease in the rate of decline, as it did not rise significantly earlier, indicating weakened selling pressure and enhanced buying support. Currently, 830 and 760 are strong support levels, with a maximum downward space of about 30%.
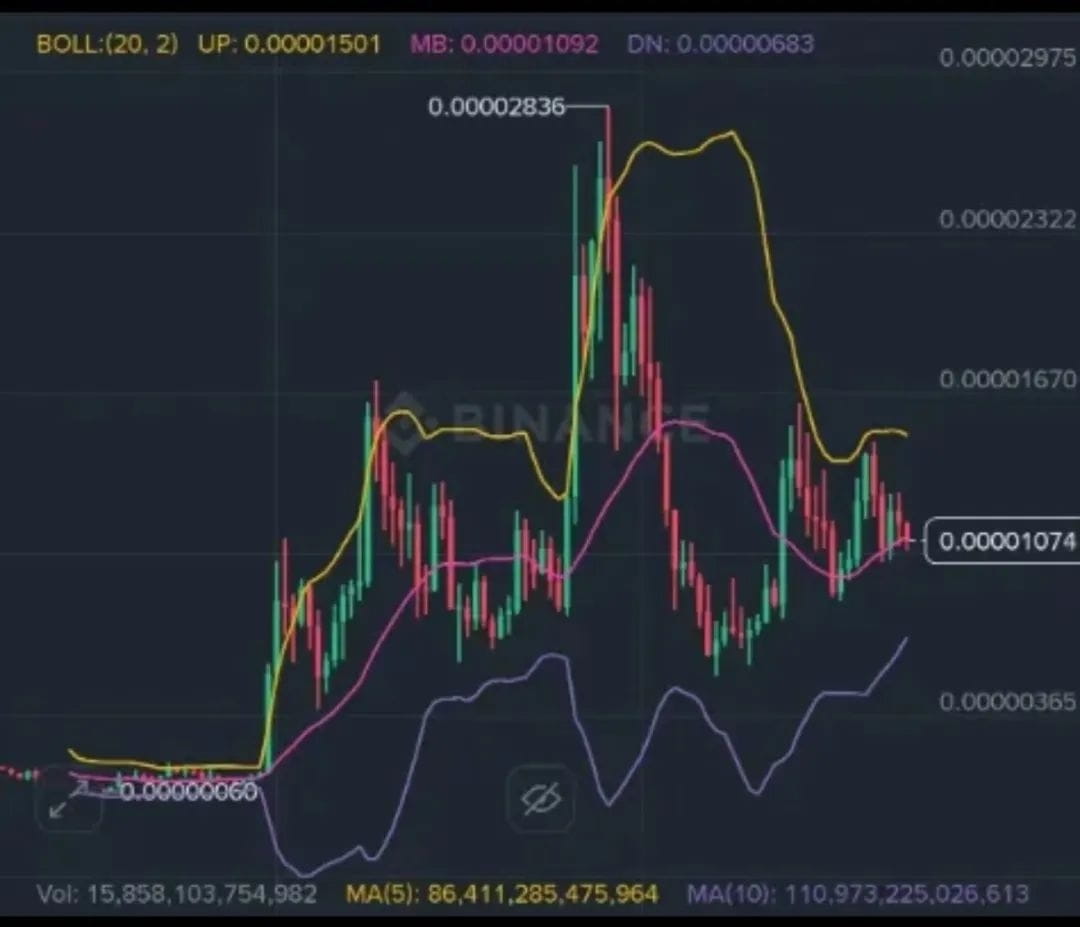
Historically, PEPE has never dropped below the lower Bollinger Band on the weekly chart, and the lower band rises at a rate of 60 points each week, limiting the downward space and time to a maximum of two to three weeks. Strategy: Wait for buying opportunities at 830 or 760.
LTC
Litecoin has a small market cap, has ETF expectations, and is a significant holding in Grayscale, making it a quality speculation target. Strategy: Buy near 105.
Overall, although the current market is in a phase of downward fluctuation, it still belongs to the recovery phase within a bull market cycle. Whether Bitcoin can hold above $112,000 will directly impact the short-term rhythm; Ethereum and altcoin leaders continue to be the core forces following the market trend, while DOGE, PEPE, LTC, etc., have supportive layout opportunities.
In this structure, the core strategy remains light positions, focusing on swings, with clear profit-taking and stop-loss strategies. Do not blindly bottom-fish or cling to battles. Waiting for the appearance of a long lower shadow with increased volume may signal the start of the next rebound.
The market is still in a bull phase, and caution is needed when bottom-fishing. Accurately predicting tops and bottoms is difficult; I will buy at the bottom and retreat at the top. More coin bottom-buying points can be consulted privately.


