

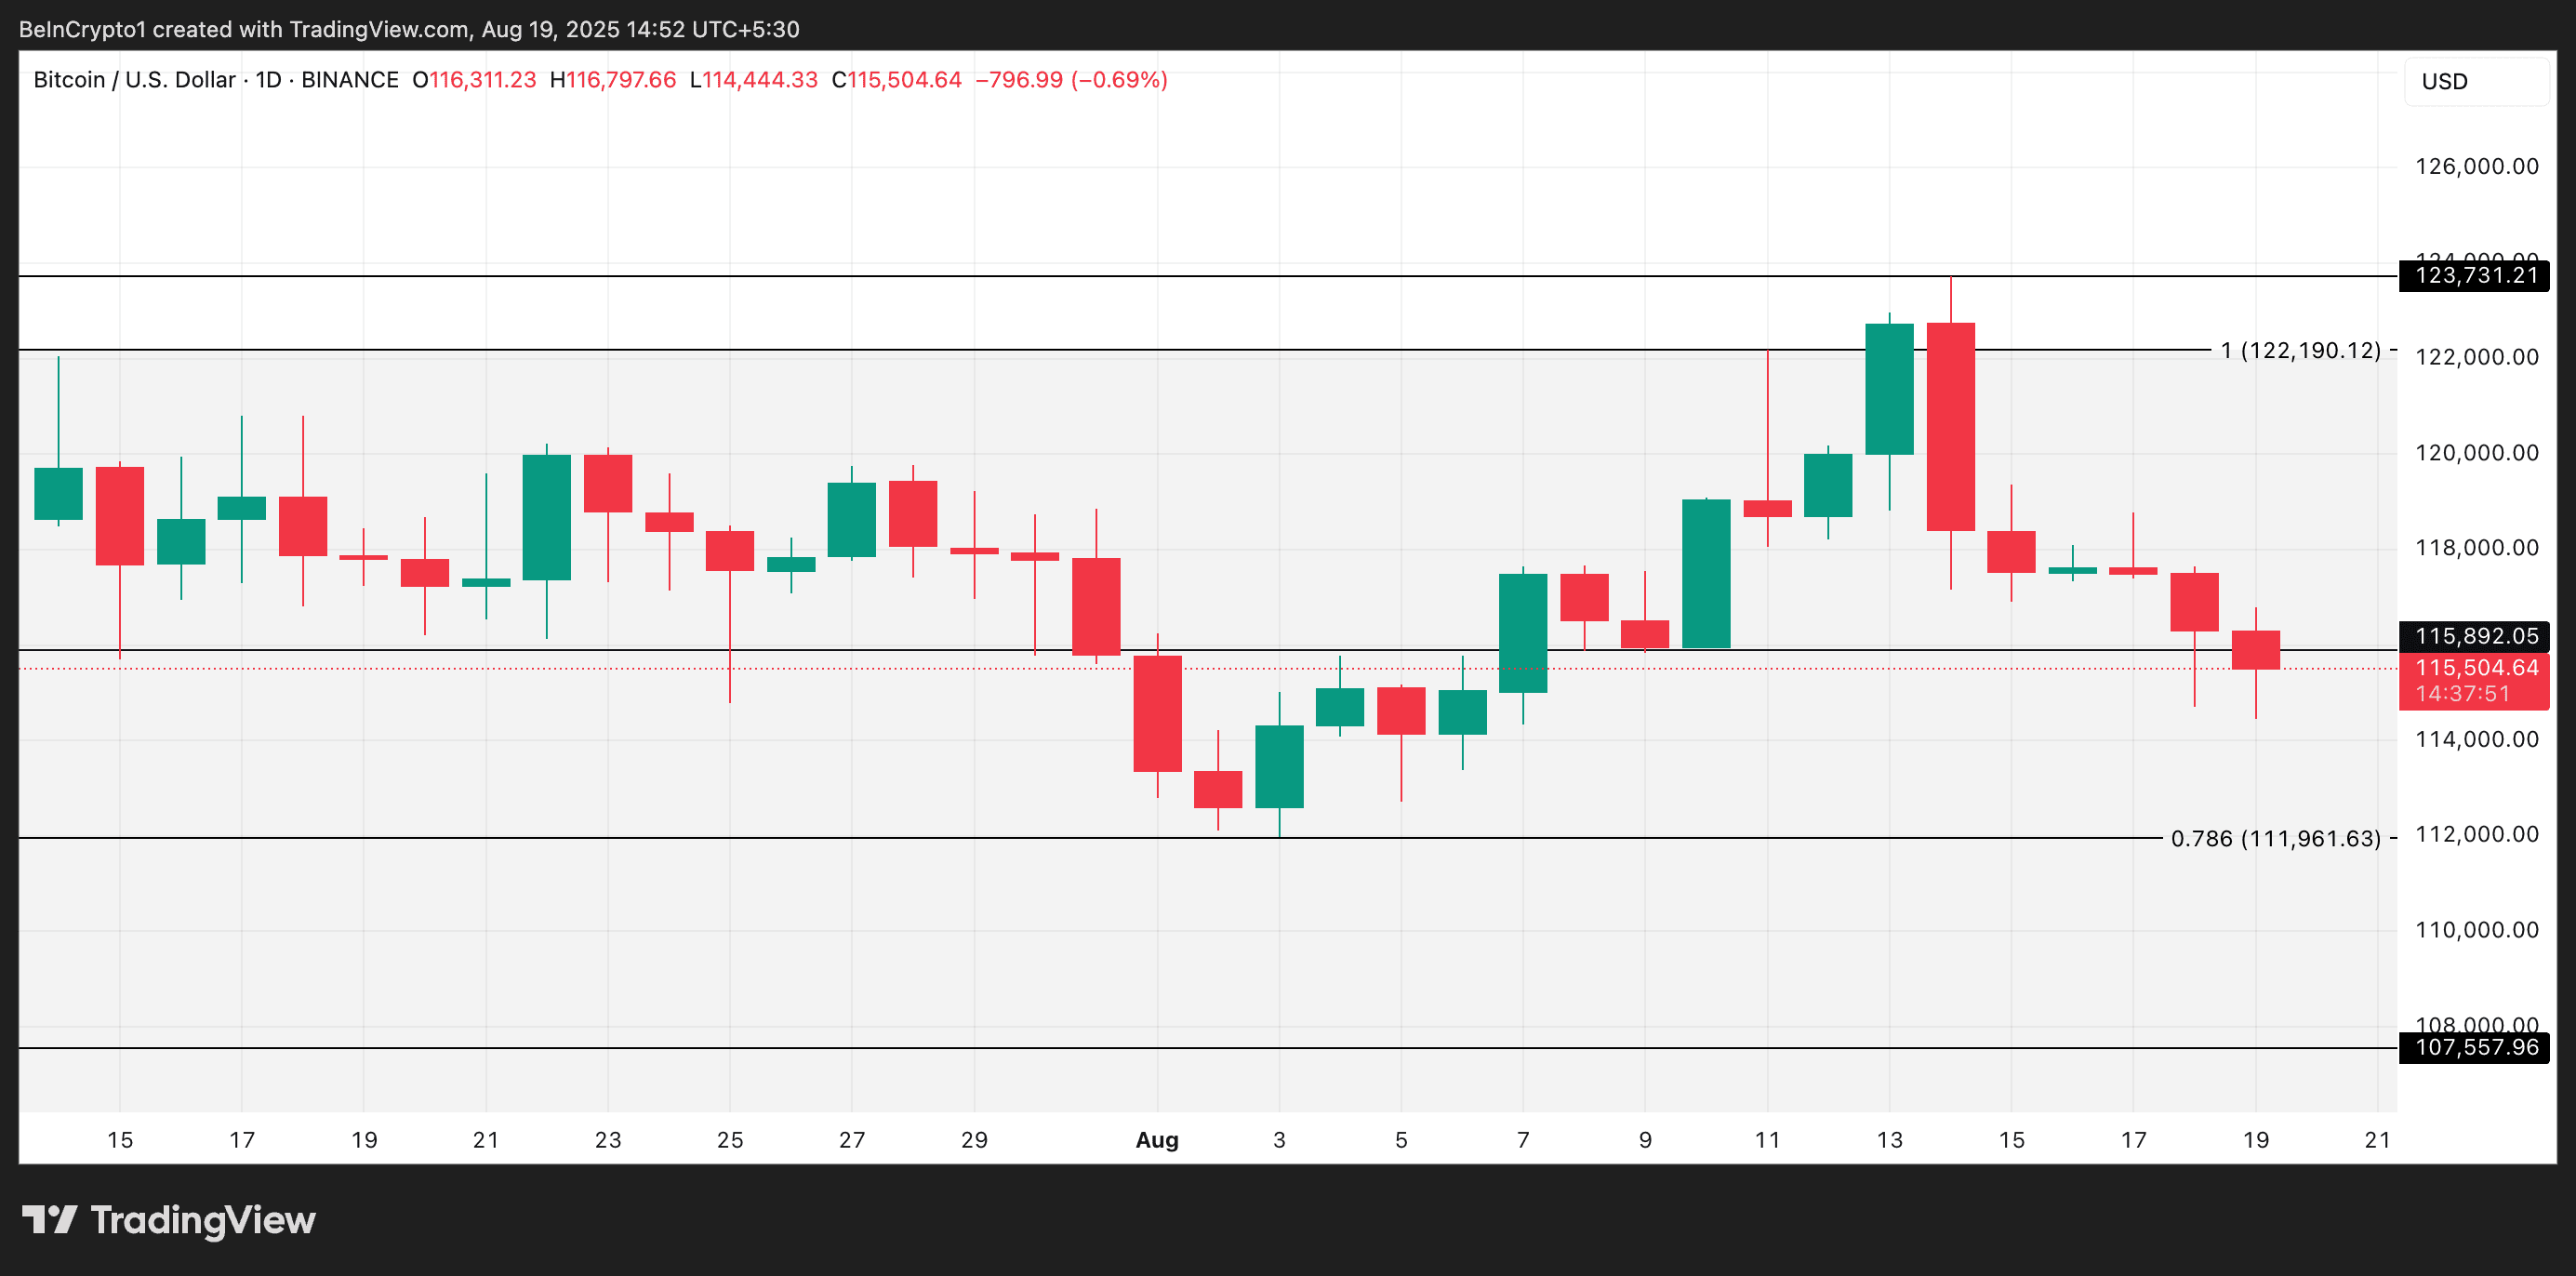
The price of Bitcoin has been on a downward trend since it reached a new all-time high of $123,731 on August 14. The leading coin is now trading at $115,892, registering a 7% drop in less than a week.
Although this pullback has raised concerns among traders, on-chain data suggests a recovery potential, led by the largest Bitcoin investors, may be on the horizon.
BTC may be entering a new bullish phase, says analyst
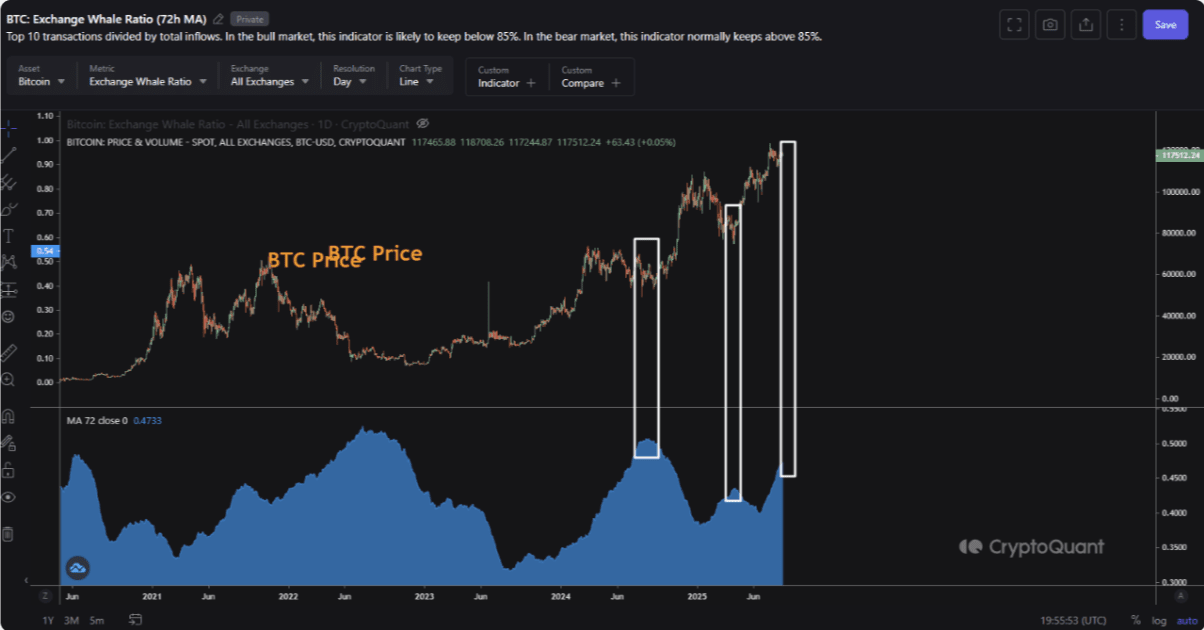
In a new report, the pseudonymous analyst from CryptoQuant, SunflowrQuant, stated that "a new bullish phase for BTC may be starting soon," as a key on-chain indicator emits positive signals.
SunflowrQuant evaluated BTC's Exchange Whale Ratio and found that the indicator rose to a zone historically aligned with local price bottoms.
 BTC Exchange Whale Ratio. Source: CryptoQuant
BTC's Exchange Whale Ratio measures how much of the coins flow to exchanges from the top 10 transactions. An increase in the index signals growing activity from large investors, usually in preparation for significant market movements.
"When this index rises, it signals that large investors (whales) are becoming more active on exchanges — often interpreted as a sign of preparation before major market movements," the report explained.
The analyst also observed the historical performance of BTC's Exchange Whale Ratio and found that the coin enters a bottom phase whenever the indicator rises to test the 0.50 level.
"Looking at the past few years, whenever the Exchange Whale Ratio tested around the 0.50 level, it often marked local price bottoms, followed by consolidation periods and then upward movement," said the analyst.
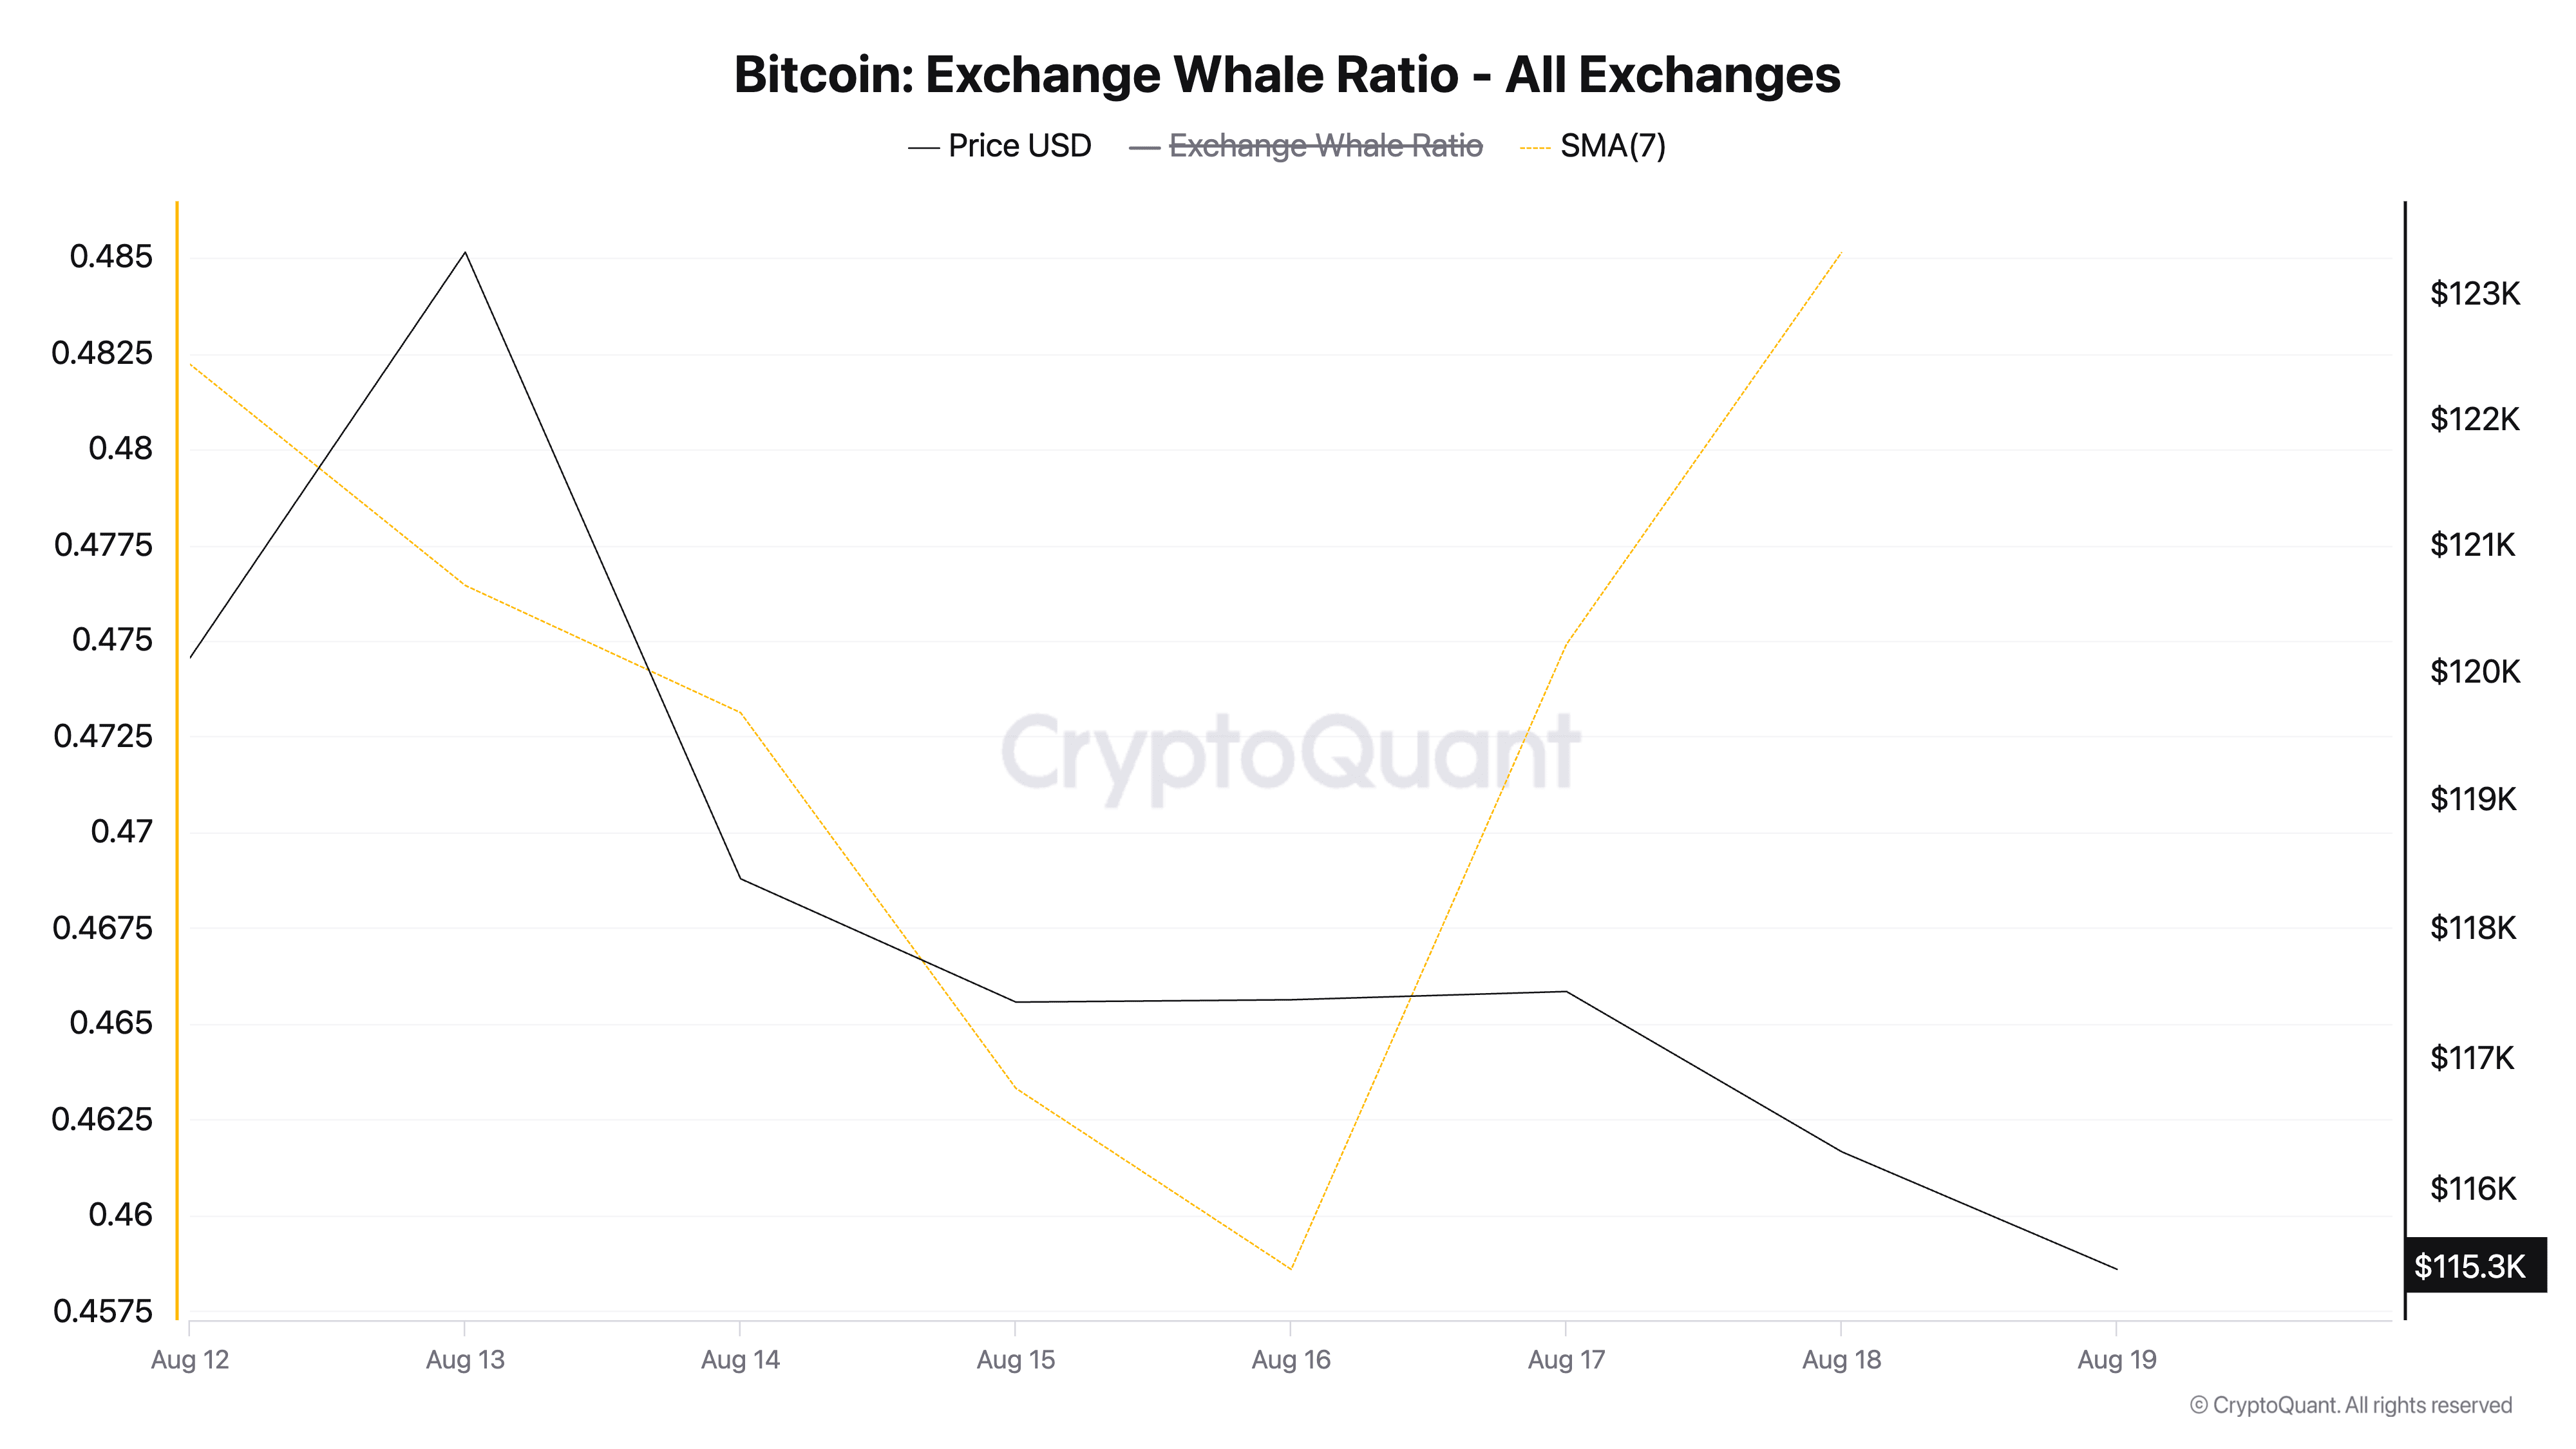
This indicator, observed using a seven-day moving average, is currently at 0.48, approaching the 0.50 mark.
 BTC Exchange Whale Ratio. Source: CryptoQuant
If history repeats itself, this pattern suggests that the recent drop in BTC's price may be nearing exhaustion, with a base being prepared for a new rally.
Bitcoin liquidation map points to price magnetism at $120,000
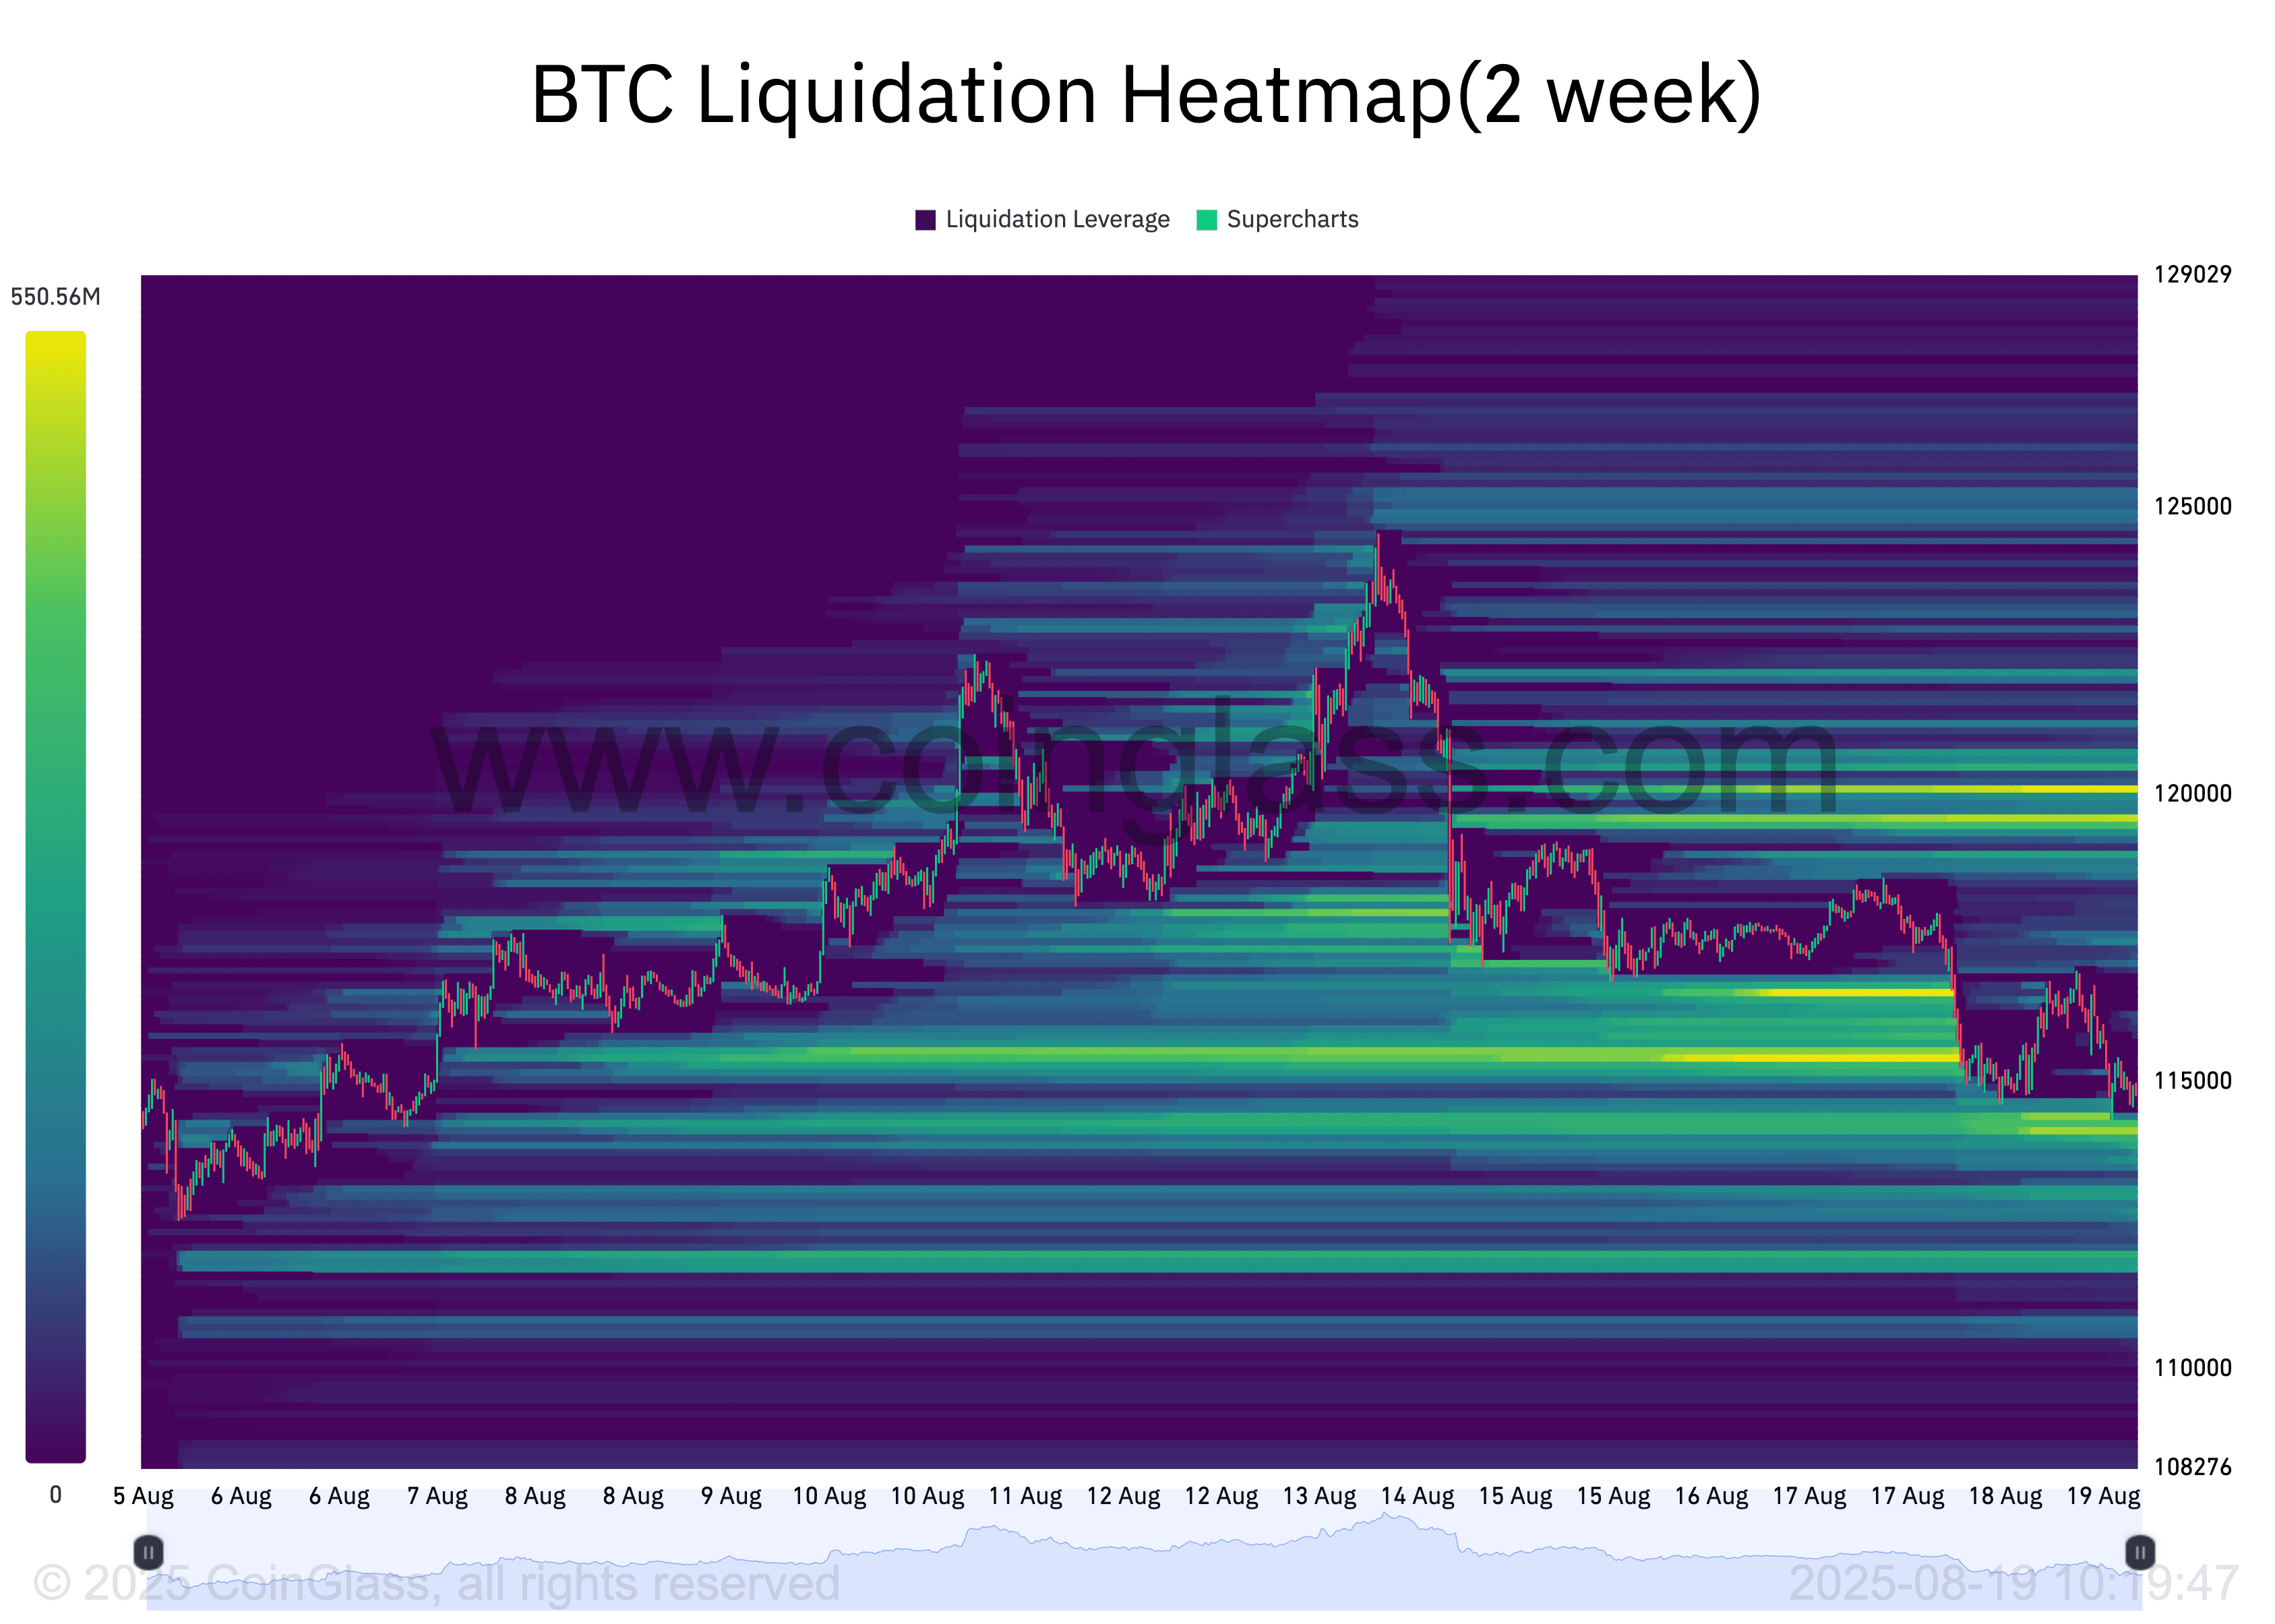
Heatmap readings of Bitcoin liquidation support this optimistic outlook. According to data from Coinglass, a concentration of leveraged positions and liquidity is above the coin's price, near the $120,000 region.
 BTC Liquidation Heatmap. Source: Coinglass
Liquidation heatmaps are visual tools that track clusters of leveraged trading positions (longs and shorts) in the market and highlight price levels where mass liquidations are likely to occur.
Generally, when capital clusters form above an asset's market value, they attract short-term bullish momentum as traders seek to exploit these liquidity zones.
Therefore, they may attract a short-term bullish momentum for BTC as traders seek to exploit them.
BTC may drop to $111,000 if sales persist
If the outlook from SunflowrQuant is confirmed and BTC finds a bottom soon, the coin could recover towards the $120,000 mark after a consolidation period.
 BTC Price Analysis. Source: TradingView
However, if selling pressure intensifies in the short term, BTC risks extending its decline to $111,961, a level last seen on August 3.
The article Bitcoin shows signs of a bottom before the next high was first seen on BeInCrypto Brasil.

