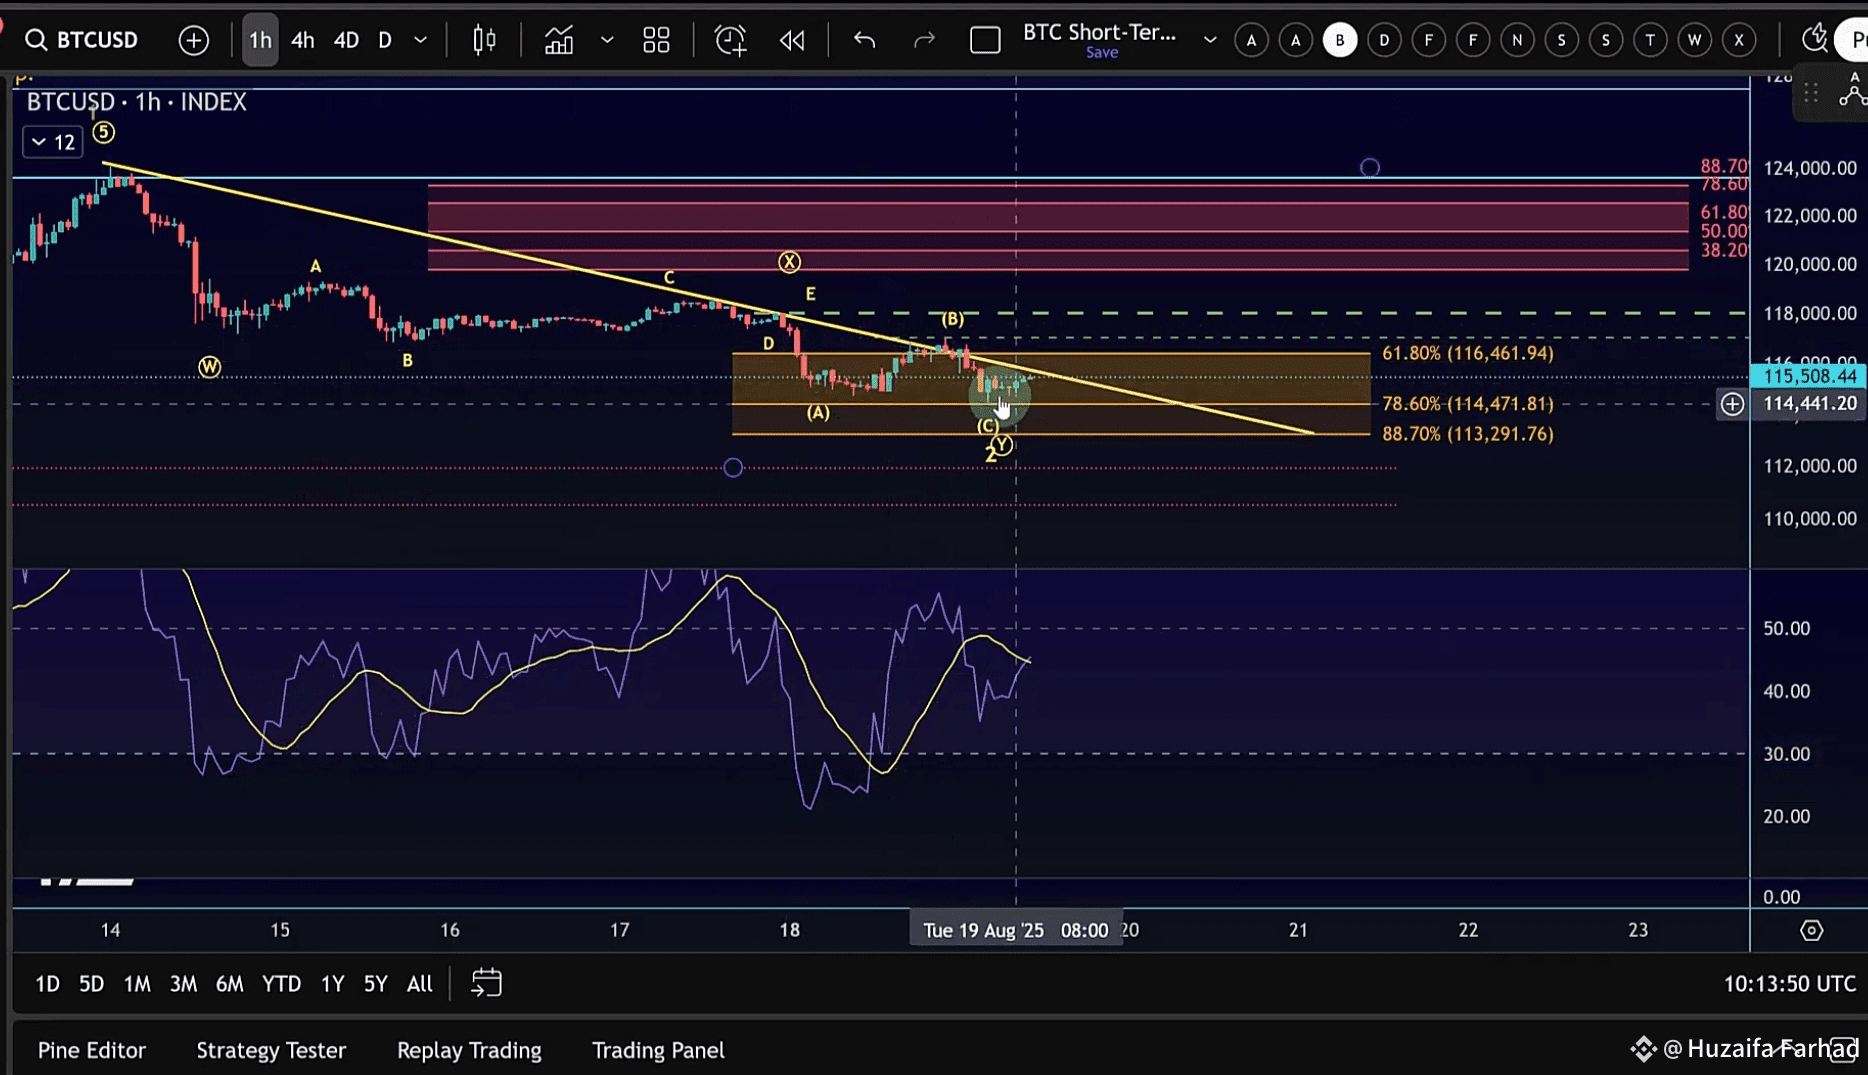
$BTC attempted to break above the signal line and yellow trendline yesterday, but the breakout failed. For now, the price is still holding above support, though the structure of the pullback has shifted into what looks like a WXY complex correction rather than a standard ABC correction.
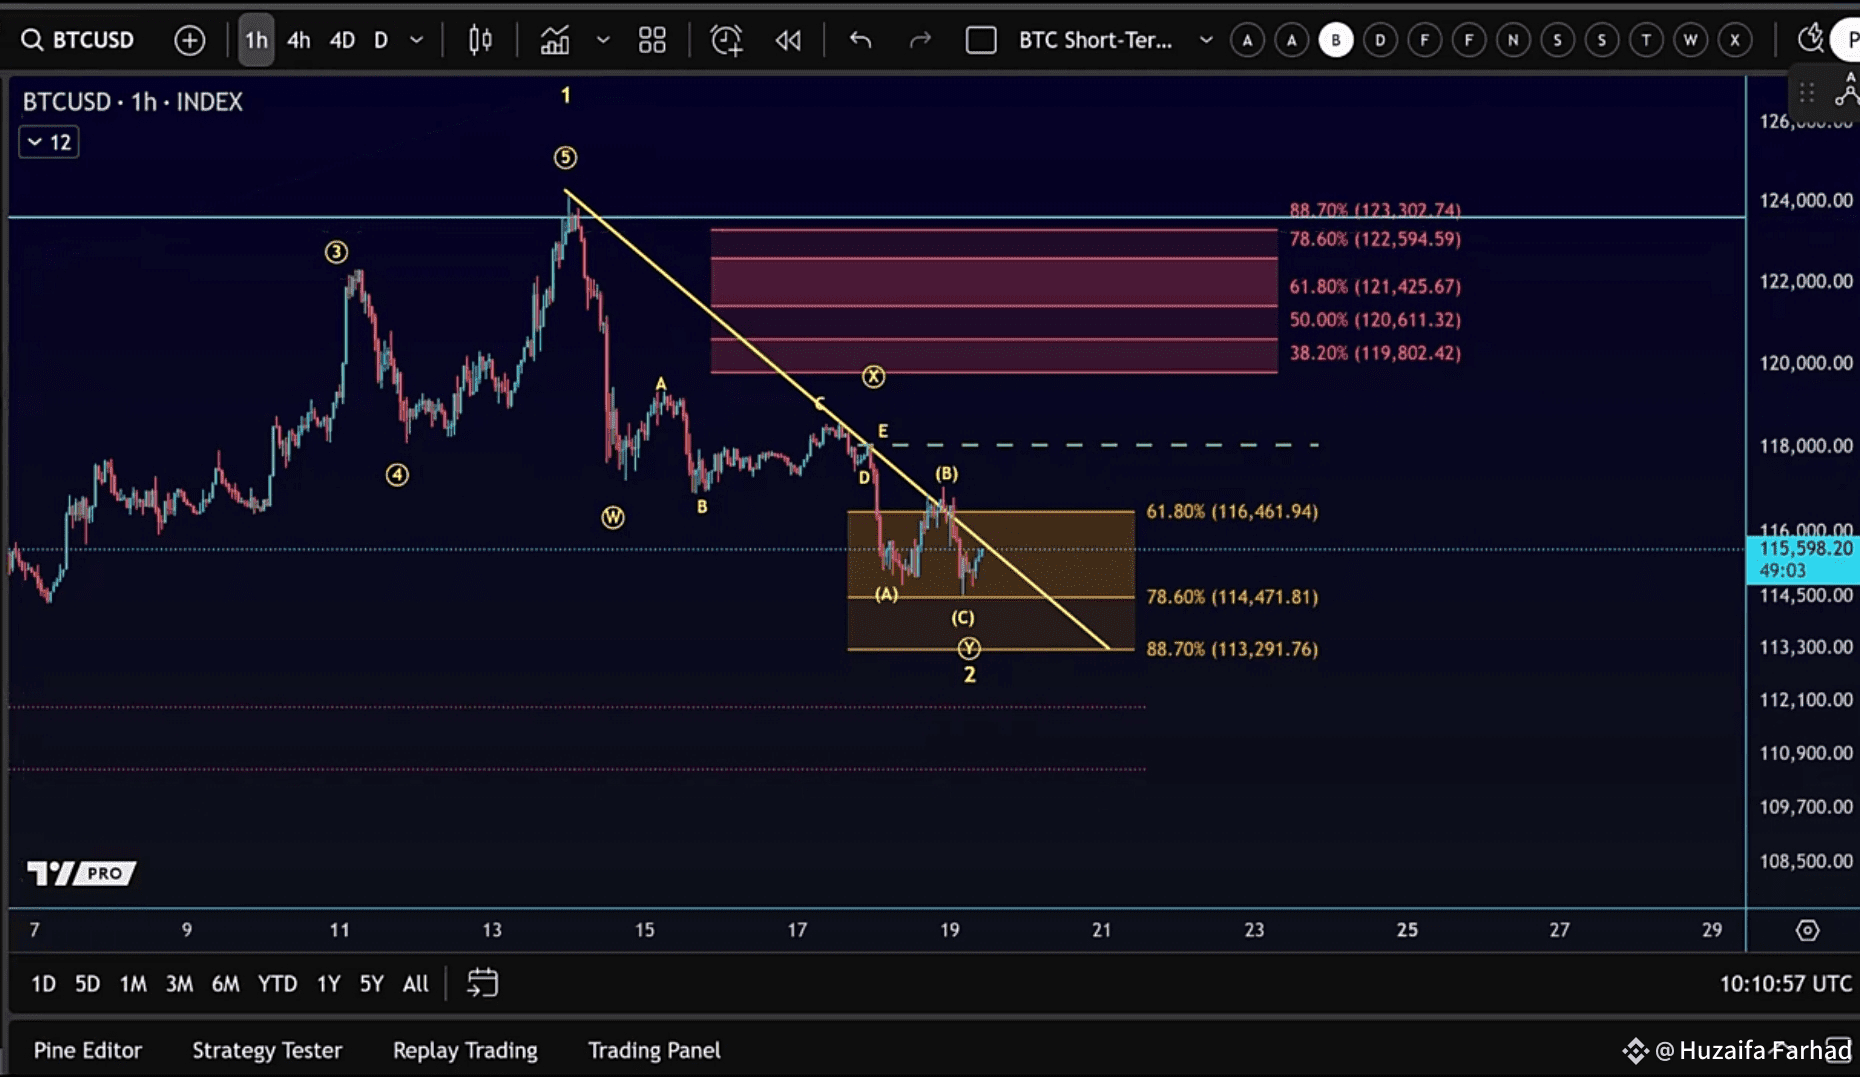
🔍 What is a WXY Structure?
Normally, corrective structures are tracked as ABC patterns:
Wave A = 5 or 3 waves
Wave B = 3 waves (a corrective rally)
Wave C = 5 waves
In a WXY structure:
Wave W = 3-wave move
Wave X = 3-wave move (often a triangle, as in this case)
Wave Y = 3-wave move
The key difference is that none of these waves are 5-wave moves, making the overall correction far more complex. In fact, even the corrections within it are corrections themselves.
📉 Support Levels to Watch
The critical support levels are:
$114,471 → 78.6% Fibonacci retracement (already touched)
$113,290 → 88.7% Fibonacci retracement (last strong Fibonacci support)
If Bitcoin breaks below these zones, probabilities for an upside reversal will weaken significantly.
📈 Reversal Signals & Key Resistance
For bulls to confirm a low and signal a possible reversal:
Break above $117,070 → early signal for a reversal
Break above $118,500 → stronger confirmation of upside momentum
Until then, Bitcoin remains in a fragile state.
👉 (Insert third chart screenshot here showing signal lines and resistance levels)
💡 RSI Divergence Watch
The RSI recently showed a small bullish divergence — while price made a lower low, RSI printed a higher low. This could suggest a potential bounce, but confirmation is still missing.