After the system is well-constructed, you must refine your entry and exit positions. At this point, you will continuously study and summarize to find trading opportunities as much as possible. Note that trading opportunities are not trading signals; this must be distinguished. Trading opportunities refer to a larger fluctuation space. Therefore, we must start from the objective factors of the market and return to the candlesticks themselves, as candlesticks are essentially a language, albeit one that we cannot read instantly.
If you want to catch the starting point of the market as early as possible, you need to return to the structure, back to the candlesticks themselves. This is a step to continuously optimize your own system. In cases where you are unfamiliar with your own system, this is almost ineffective, because you do not understand the system, the market, and even yourself. The prerequisite is to consider this part after achieving stable profits. Let's not discuss that for now; this chapter will focus on the sequential changes between candlesticks and the transformation between bullish and bearish.
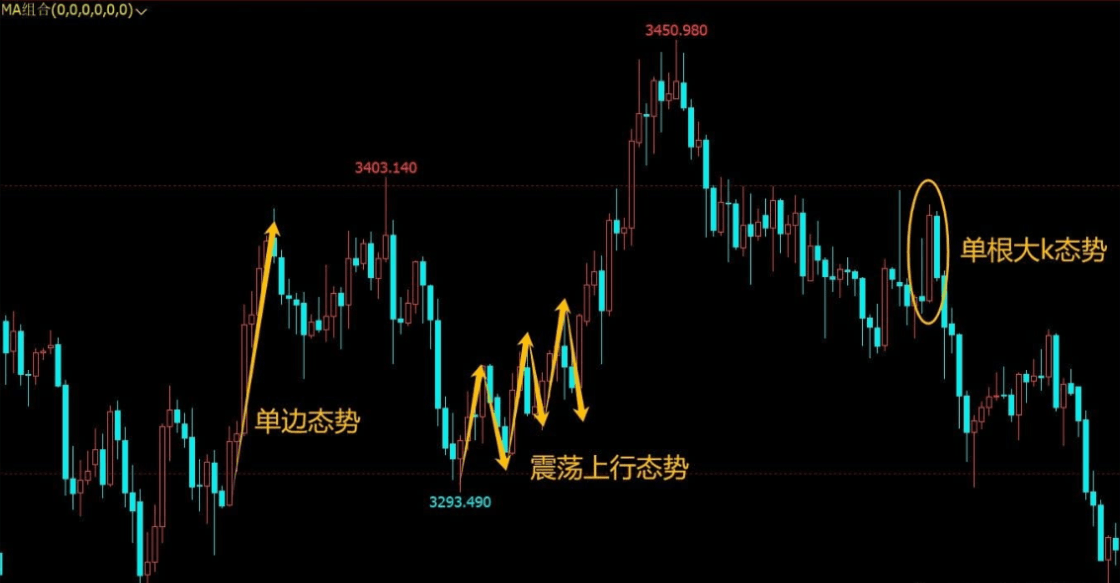
When we get a cyclical chart, the first thing that catches our eye is the candlesticks. Their trends exhibit various changes, likely falling into three types of trends (this is a name I came up with myself; feel free to name it however you like, even 'Zhang San' or 'Li Si' will do, as long as you understand the meaning). One is the unidirectional trend, another is the oscillating upward or downward trend, and the third is the large candle trend. Let's look at them one by one, as shown in the figure below:
Trend is not the same as pattern; you need to understand this. The arrangement of market candlesticks is fundamentally based on these three types of trends (note that this refers to the trend of attack, not the oscillating trend!).
From a broader structure, we can now see clearly the operational rhythm or context of most markets. However, when dealing with trades, understanding the causality between candlesticks can provide unexpected assistance in understanding the market, knowing when to reverse or adjust, which may help us seize significant trading opportunities. We also know that the increase in our accounts often comes from just one or two trades each month or week; most of the time, the results are small losses or small gains.
So how do we specifically analyze the causality of candlesticks? Combining the three types of trend situations mentioned above, we first need to provide a simple definition of these three situations; otherwise, it will be difficult for you to understand the trend.
Unidirectional trend: In an upward trend, each candlestick makes a new high, and the lows do not break the previous candlestick's low (isn't this similar to the definition in Dow theory? Almost, to put it bluntly, it's a micro change).
Oscillating trend: In an upward trend, it often occurs in the early chaotic stage or at the end of the trend, where not every candlestick makes a new high, and not every candlestick compared to the previous one breaks the previous candlestick's low. There is a noticeable (visibly apparent) upward retracement trend, which I refer to as an oscillating trend.
Single large candle trend: Generally appears at the beginning and end of a trend, similar to oscillation. This is easy to understand; it refers to the movement where a large candlestick directly reaches a certain position. (Of course, you should ideally make a division or rule for what size constitutes a large candlestick. I like to compare it with the previous 30 candlesticks; if it is larger than those, I call it a large candlestick. This is also not fixed; just set your own rules for judgment.)
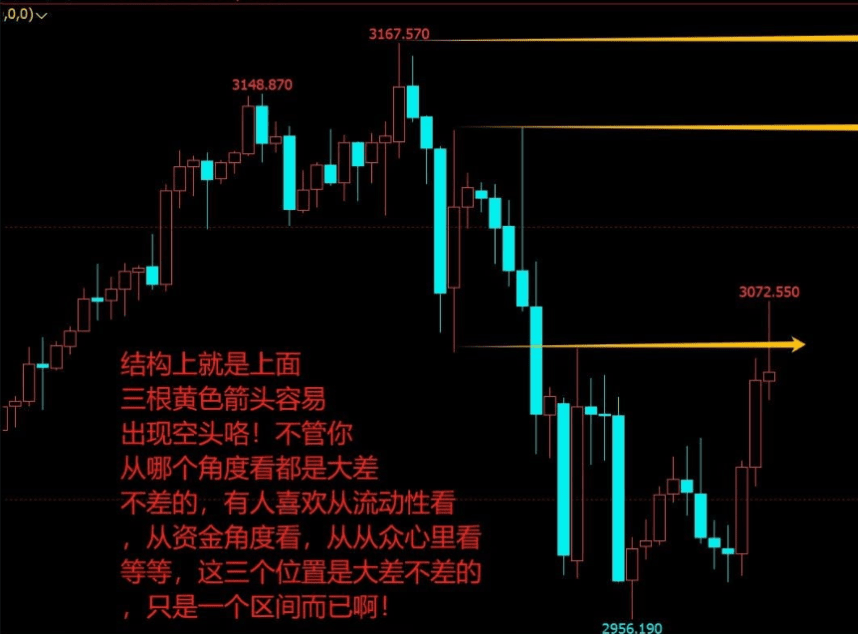
The three types of market trends have been simply defined, but why are some trends unidirectional, some are oscillating, and some are characterized by large candles? To understand this question clearly, we must carefully analyze the previous and subsequent candlesticks and their spatial positions, as shown in the figure below:
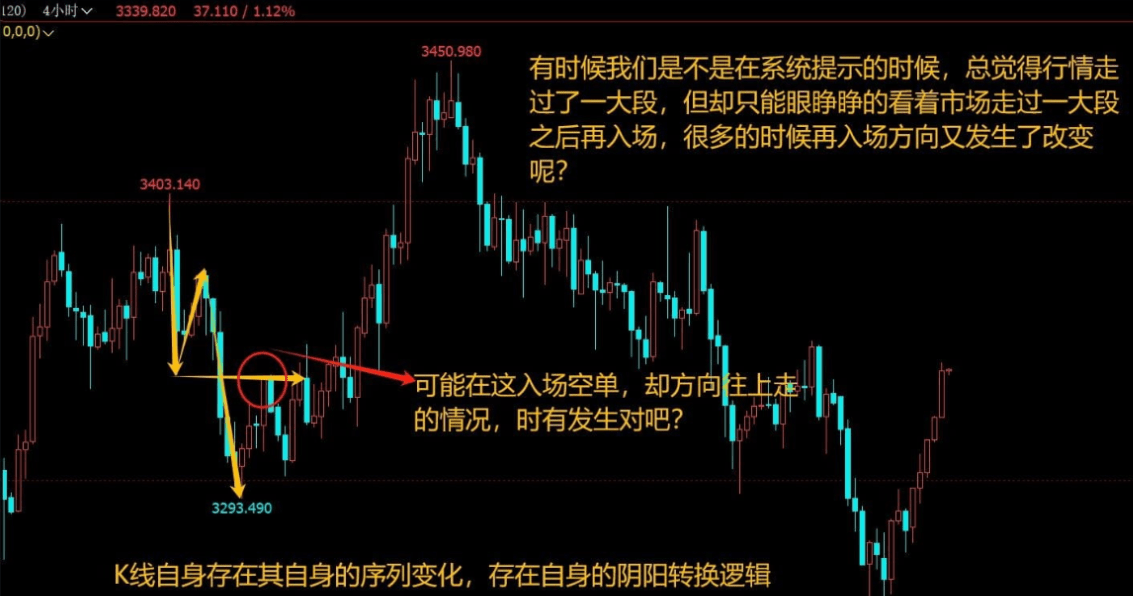
For example, in the three yellow circles in the above image, in hindsight, everyone can understand why there was a downward movement at that position. It's just that the first two declines were stronger, while the last decline was relatively weaker. Therefore, judging the causal relationship between candlesticks becomes crucial.
Unidirectional trend: Candlesticks are almost all consecutive bullish or bearish; oscillating trend: it is inevitably a change in the relationship between structures; large candle trend: it is inevitably at the beginning or end of a trend (adjustments are also often seen, and this is relative).
When we first start learning about candlesticks, we often say that after a bullish candle, there is a high probability of another bullish candle, and after a bearish candle, there is a high probability of another bearish candle. However, sometimes after a big bullish candle, it is immediately followed by a big bearish candle. The main reason is the causal relationship between candlesticks. From previous articles, we know that the occurrence of high or low points is often the result of force leading to a reversal or a breakthrough brought about by structure. So, to refine this, we focus on the size of the candlesticks and the relationship of the number of bullish and bearish candles. If we look at it in conjunction with the structure, finding slight changes within the market becomes much simpler, as shown in the figure below:
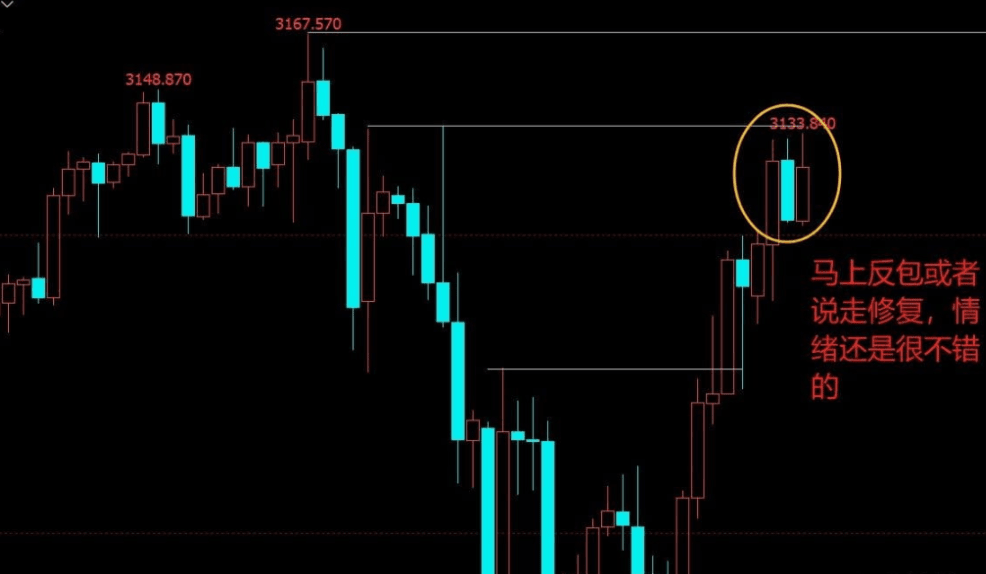
In the above image, at the bottom yellow arrow, a long upper shadow small real body bullish candle appeared. This type of candlestick at this position is where the vast majority of traders are bearish. You can short or wait for another candle; everyone's trading style is different, and there's nothing wrong with that. However, the change in the next candlestick, the change between bullish and bearish, becomes an important basis for your judgment. If it is a bullish candle, it proves that this is an adjustment. To put it more bluntly, it means that the bearish force is not strong (using a saying from the stock market: if it should fall but doesn't, it means it's rising; this is the causal relationship before and after). Let's look at the situation of the next candlestick, as shown in the figure below:
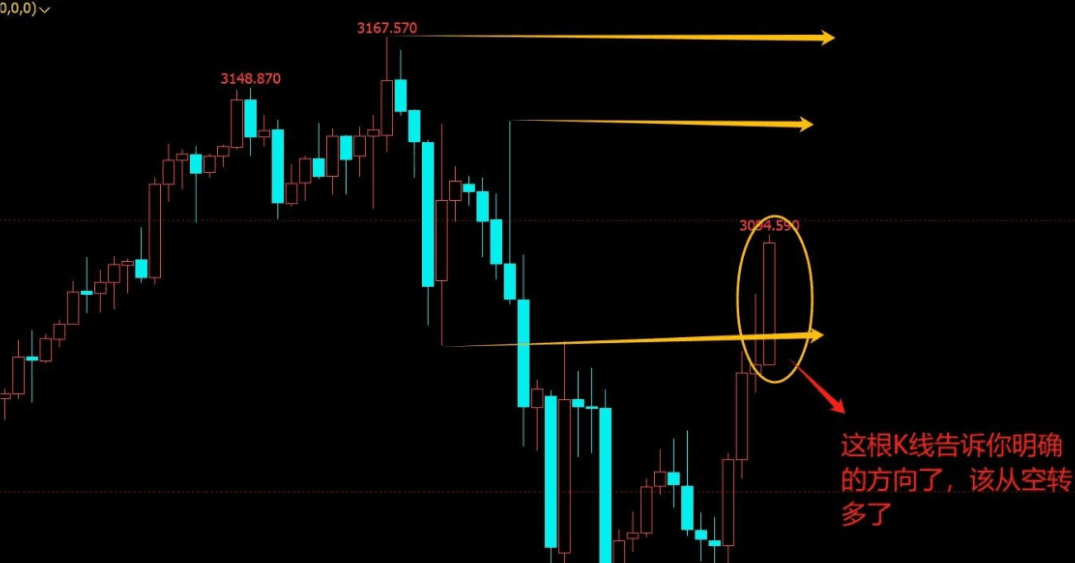
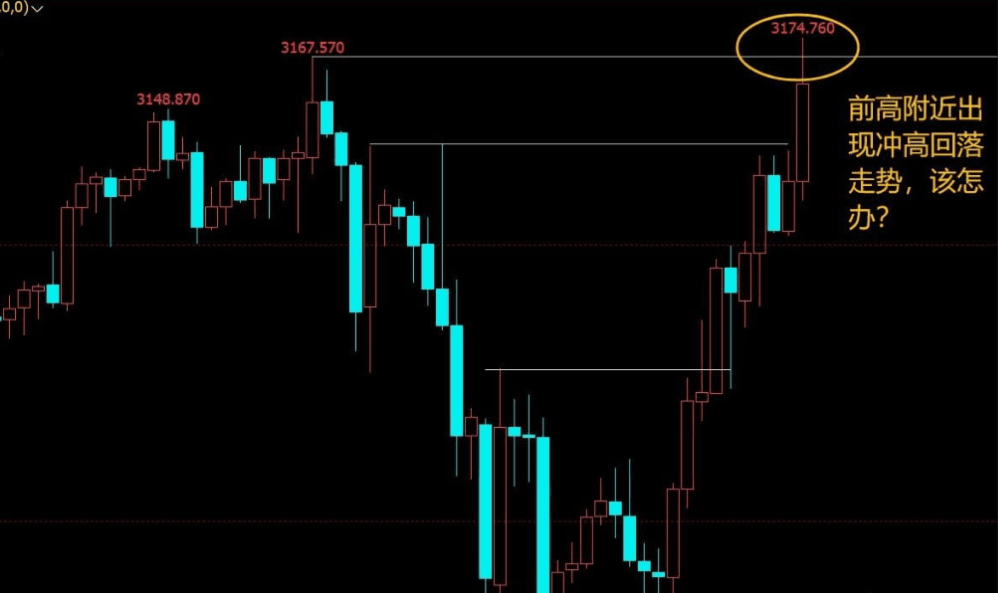
The trend in the above image was expected to decline, but not only did it not decline sharply, it also surged sharply. Bullish sentiment is high, and most traders believe that this adjustment has ended. However, whether it is sufficient often requires a retracement to confirm, which is why I rarely enter the market immediately when such candlesticks appear. Generally, I wait for an internal W pattern before entering, as shown in the figure below:
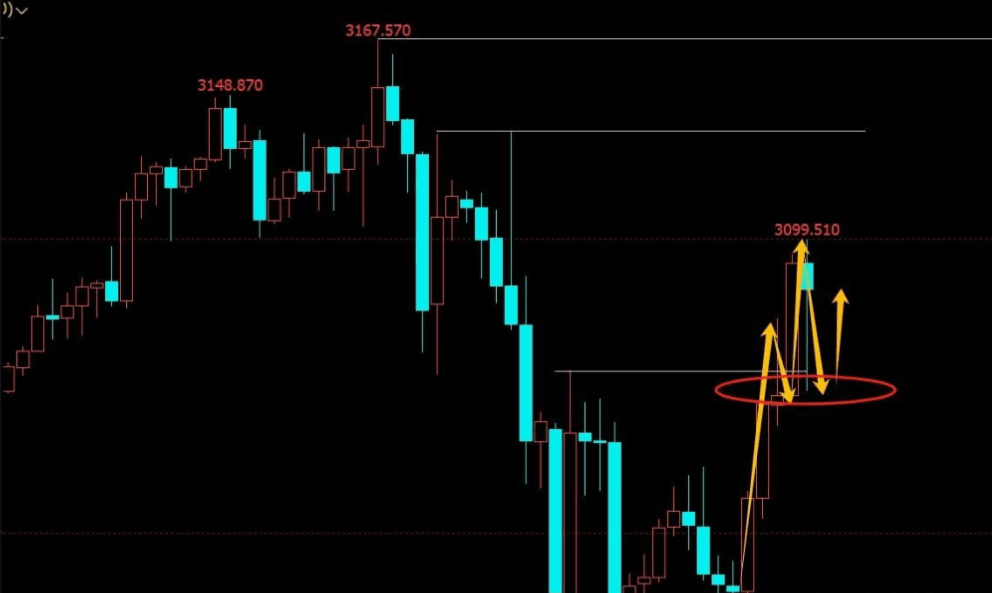
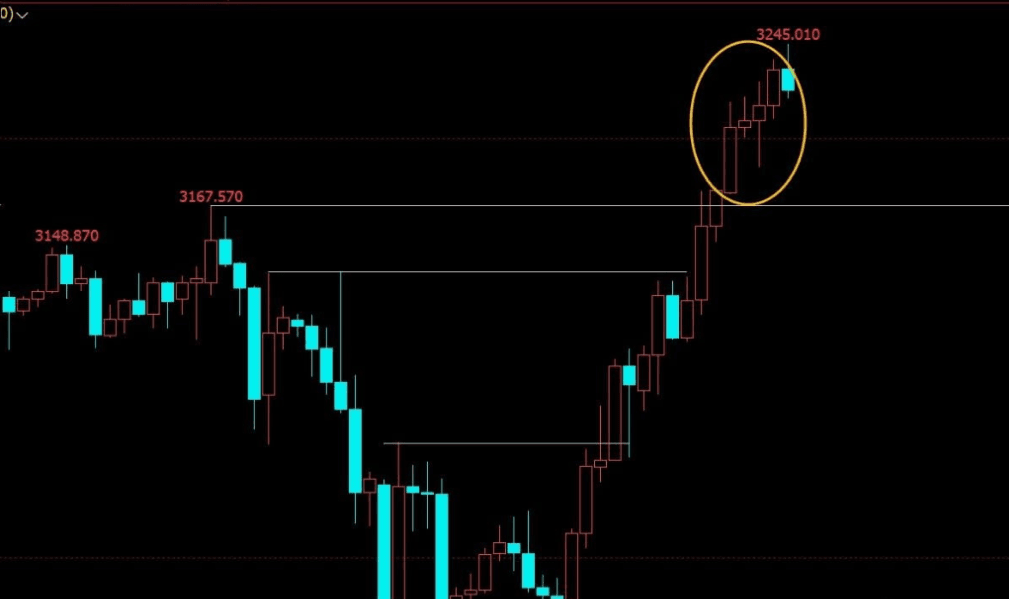
It has risen, confirming the validity of the previous low point. Enter to go long and see what happens at the position of the above candlestick, as shown in the figure below:
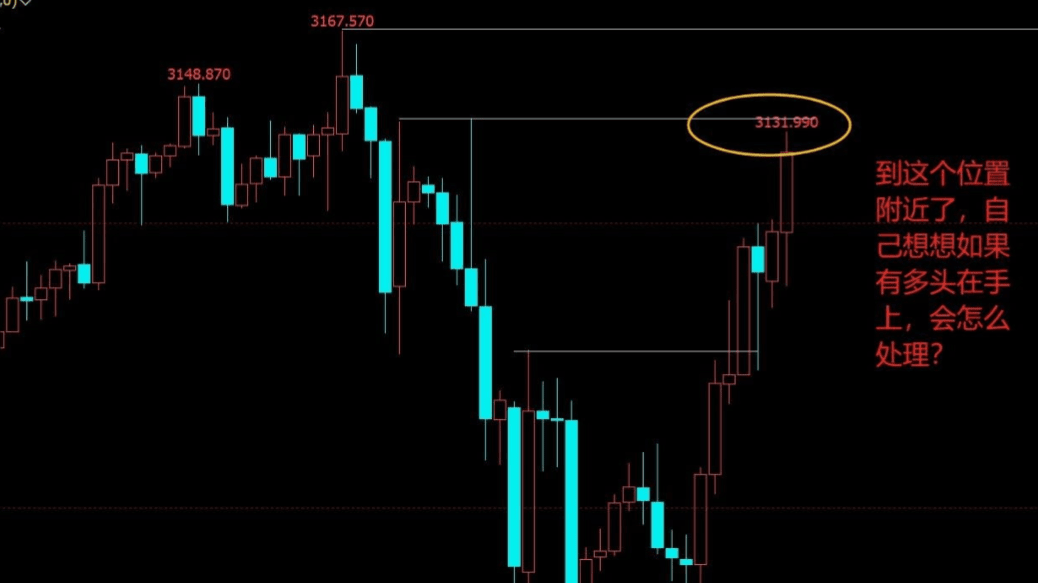
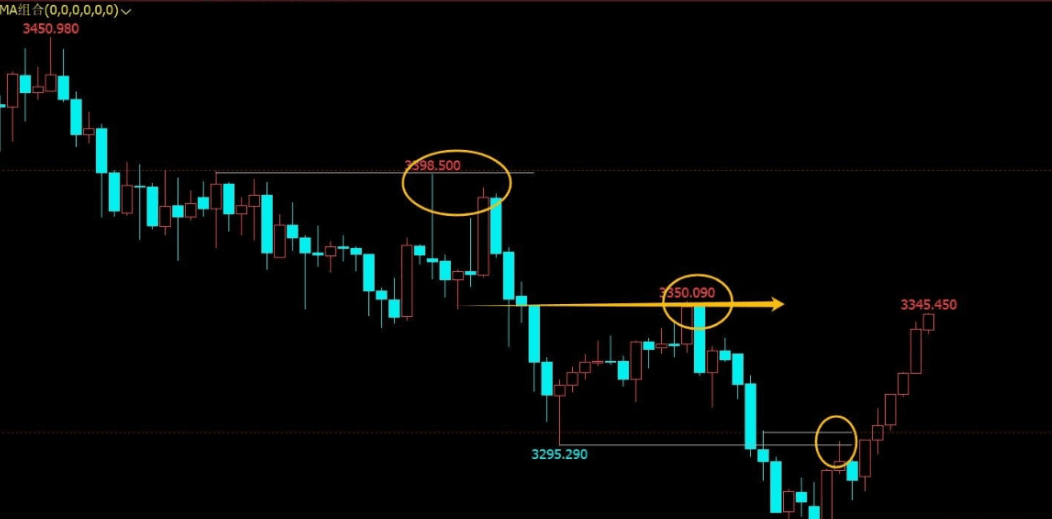
Isn't the causal relationship between candlesticks actually still a structural issue, mostly focusing on points near structural levels? Why do people like to work near structural points? It's simple: the psychology of conformity and expected performance, or imitation. If there was a significant bearish space at the previous white line position, can it replicate that and create a certain bearish space again? If this is difficult to understand, you can relate it to the situation where the leading stocks in the stock market fall, and then the lagging stocks start to rise; this is the reasoning behind it. In simple terms, it reflects the traders' psychological performance; whether a consistent viewpoint can be achieved at this position must be judged through the candlestick performance. Continuing further, as shown in the figure below:
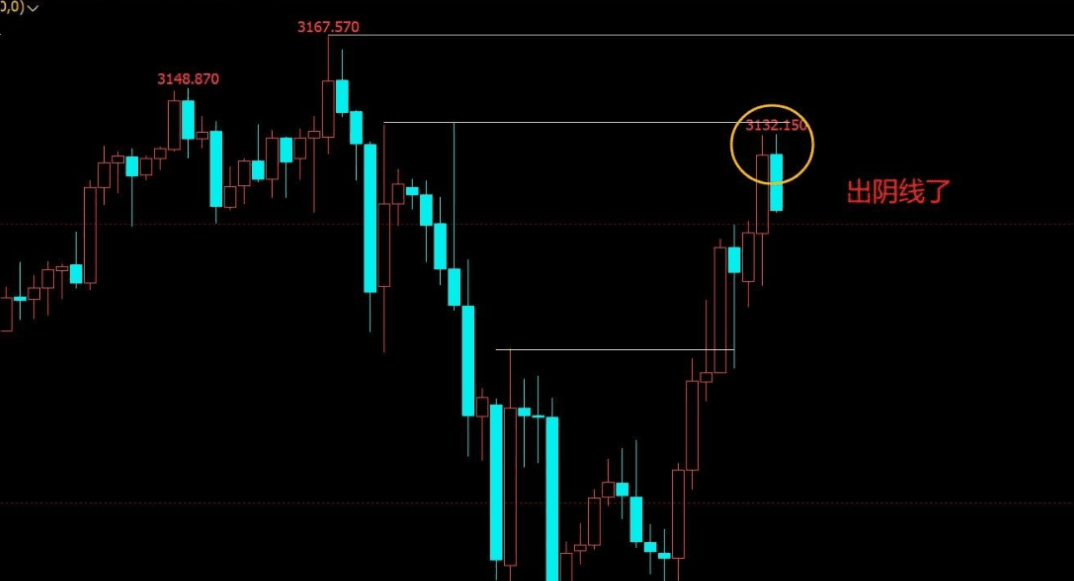
Looking further down, is this an adjustment or a potential reversal? For now, it is certainly viewed as an adjustment, especially since it is near a previous high point, and this line is not very strong. Continuing to look down, as shown in the figure below:
At least this trend indicates one thing: this place may not follow the previous pattern; you can continue to hold long positions. Let's look further down:
If you are unsure, you can move your stop-loss up or reduce your position to control the drawdown, as long as what you can accept is feasible. Let's continue downwards:
Directly broke through, or effectively broke through. Some people ask what effective breakthrough means. An effective breakthrough, in my terms, is when three lines stand above the breakthrough with a certain distance; then a retracement becomes an entry opportunity. Of course, the previous breakthrough is also an entry opportunity. Everyone's choices and risk preferences are different; there's nothing more to say. Let's continue downwards:
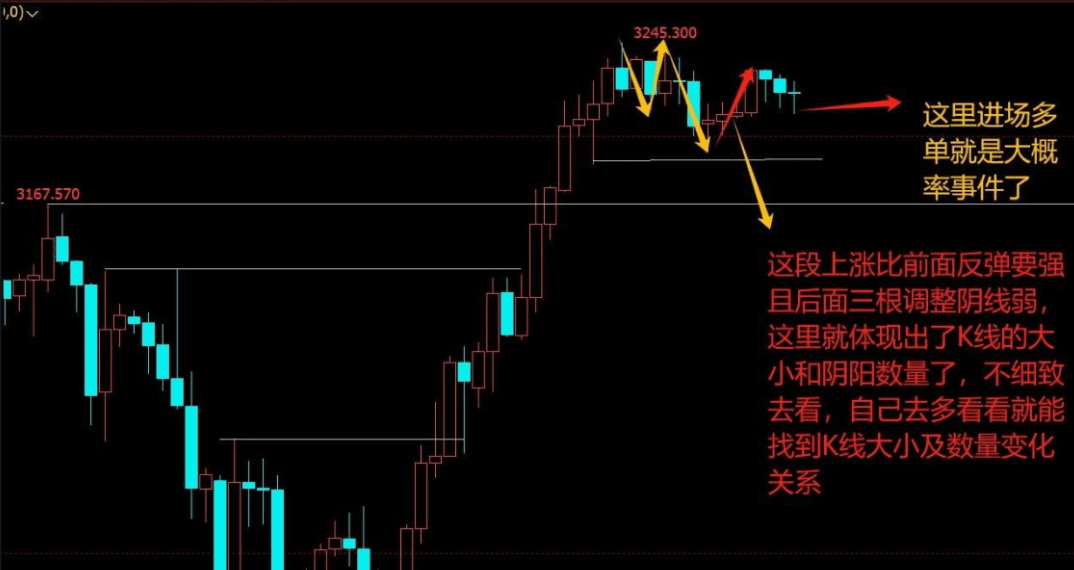
The reason why entering the market there is highly probable is as follows:
1: The trend is upward, breaking the previous high opens up upward space.
2: The previous high has not been reached during the retracement, and bullish sentiment is high.
3: The size of the candlesticks and the number of bullish and bearish candles are clearly bullish large and bearish small at this position, with more bullish candles than bearish and small bearish candles, so going long is not an issue.
What is the actual situation? Let's look down:
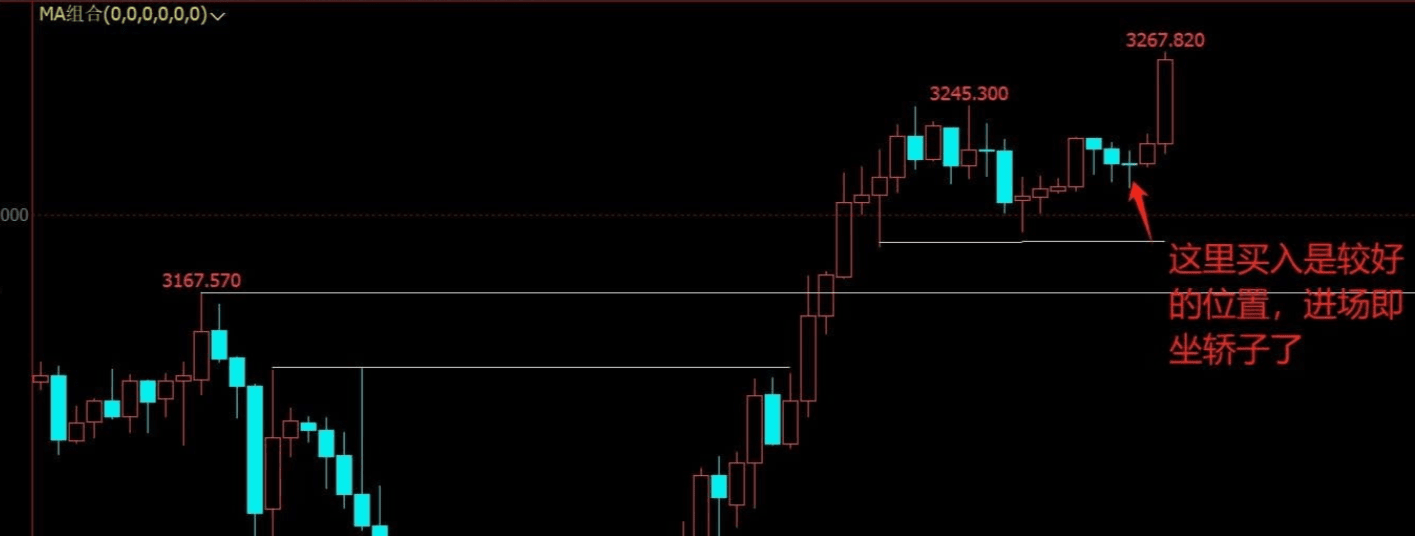
The causal relationship between candlesticks is not merely the relationship between two adjacent candlesticks; it mainly concerns the overall background, the arrangement of previous and subsequent candlesticks, and the comprehensive situation of candlestick sizes and quantities. If viewed in isolation, it is indeed difficult to understand; at least, I still find it hard to achieve the realm of knowing autumn from a falling leaf.
Many prominent traders I know have reached a deep understanding of the transformation between bullish and bearish candlesticks. Therefore, their trading operations often involve placing orders to buy at the bottom and sell at the top, with a very high success rate. When I consulted one of them, he told me a phrase for me to comprehend on my own, which I still haven't understood to this day: 'Large candles, small candles, more bearish, fewer bullish, more bullish, fewer bearish, half bearish, half bullish, how to follow, adapt, and differentiate.'


