Entered the market in 2017 and have been trading for eight years, with over six years of professional teaching!
I am Awen, focusing on cryptocurrency for eight years.
Previously, I traversed from stocks, futures, and gold. I found that the most interesting market is the cryptocurrency market! The charm of this market is not only the T+0 trading mechanism but also the infinite possibilities of this market! The main play is to focus on mainstream coins, and after solidifying the fundamentals, engaging in contracts is just a bonus! Starting with small capital and low leverage to control risks while ensuring the principal for manageable trading!
In the cryptocurrency sphere, there must be a high-quality community.
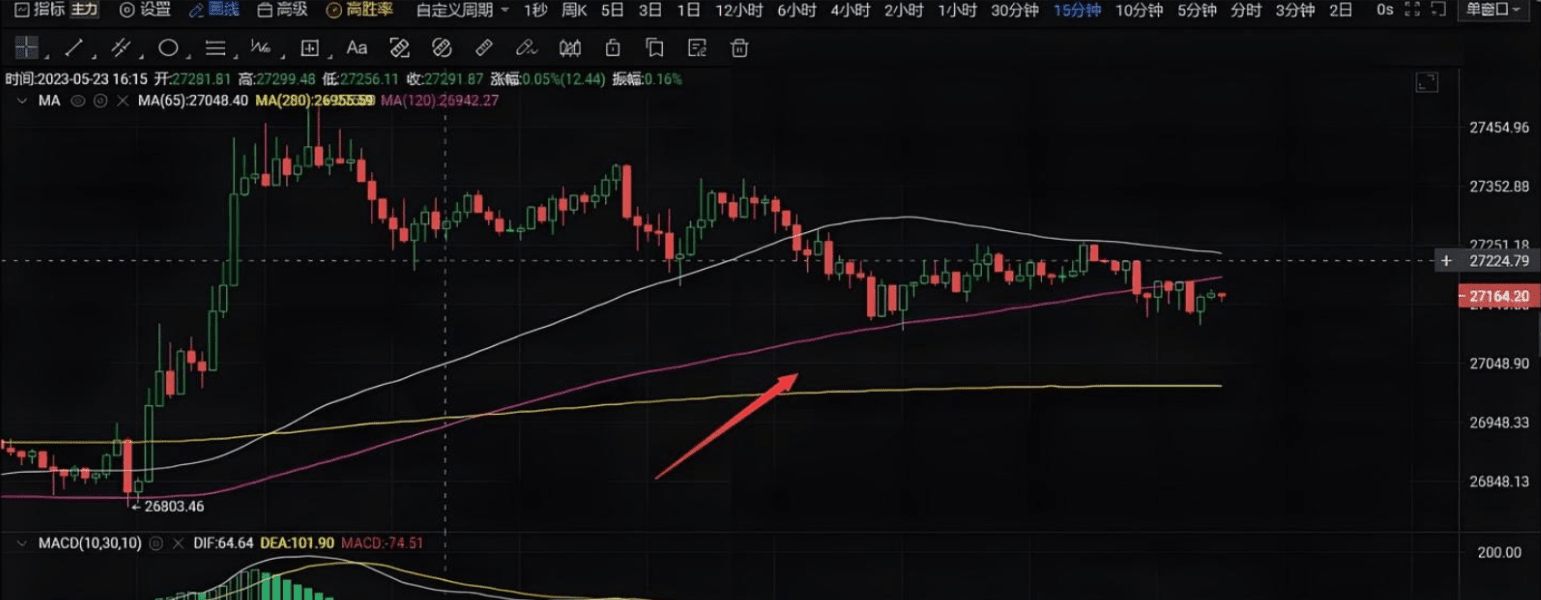
Many partners have previously asked the teacher to explain MACD, and before discussing MACD, I must first talk about moving averages. There are many moving average strategies in the market that seem very mysterious, so today I will reveal the secrets of moving averages:
What are moving averages?
The moving average, abbreviated as MA (Moving Average), is the average price during a specific time period.
Moving averages can be classified into three types:
1. Reversion
For any asset, its price always fluctuates around its value, and when the expected profit target is reached, it will be sold for cash, just like the gravitational force of the earth; if it deviates, it will be pulled back, which is what we often refer to as divergence.
2. Support and Resistance
This is also a main reason why many people are obsessed with using moving averages. The moving average is the average cost, the average price of densely traded areas (both breaking down or surging are rapid and alternating principles), and has a strong support and resistance effect. Pulling back to cost has support, breaking through cost has resistance, just like needing to accelerate when breaking through an obstacle while driving.
3. Trend
Long-period moving averages have continuity, are very stable, and have the role of revealing trends.
The downside of moving averages is their serious lagging nature.
The prices we see are superficial; the essence is the value behind the price.
Making decisions based on price is just superficial; the core is value, whether it has been accepted and recognized.
In actual trading, retail investors always see price fluctuations, and their emotions will be affected, causing volatility.
Long moving averages have stability but lack sensitivity;
Short moving averages have sensitivity but lack stability.
In actual operation, moving averages have hidden attributes and reversion properties, which will face a series of issues. If these issues cannot be resolved, it will affect our trading judgments, leading to unavoidable errors in results. Can moving averages solve these problems?
When will it be pulled back? At what price will it be pulled back? How much will the pullback be?
Moving averages cannot solve these core key issues,
therefore they cannot help us trade effectively.
These substantial issues must be resolved during the trading process, so in order to fully reveal all price fluctuations, the upgraded channels have given rise to BOLL (Bollinger Bands) and MACD.
BOLL (Bollinger Bands) specializes in support and resistance, MACD specializes in the strength of the trend.
A single moving average has obvious limitations, including the moving average system; these are actually basic technical indicators that cannot be more basic.
Having seen this, will everyone still find moving averages mysterious?
Will you still think about relying on one trick to eat well everywhere?
Any technical indicator is an auxiliary indicator and can only help us increase the probability of trading.
The MACD that emerged is based on this, solving the core problems that moving averages cannot address.
The core concept of MACD design: secondary processing of data
MACD originates from moving averages, with the data source being the closing prices of each K-line; it is a secondary processing of these data, thus being more accurate and objective.
Just as MACD is revered by many retail investors, it has widespread applicability, reliable judgment accuracy, relatively accurate trend judgment, and a very high popularity rate.
As mentioned earlier, moving averages are relatively lagging in tracking market trends, so they are generally not suitable for short-term trading, especially contracts. For short-term trading, Bollinger Bands' support and resistance are more effective, which I will share based on practical cases in future articles.
Today, let's start with the origin of MACD. In the future, I will discuss the basics, structure, golden cross, death cross, top and bottom divergence practical application techniques, as well as volume and MACD combination strategies.
Looking again at the MACD indicator settings, you can understand why many stock market trading experts struggle in the cryptocurrency sphere.
The basics of MACD and the structure of the MACD indicator:
The MACD indicator consists of four fundamental parts:
1. Study the strength of the trend (depth of movement)
2. Explore changes in strength (speed of movement)
3. The MACD histogram can only express whether the trend is weakening or strengthening
4. MACD is a lagging indicator (a natural attribute, it is a secondary processing of moving average data, which is already quite lagging)
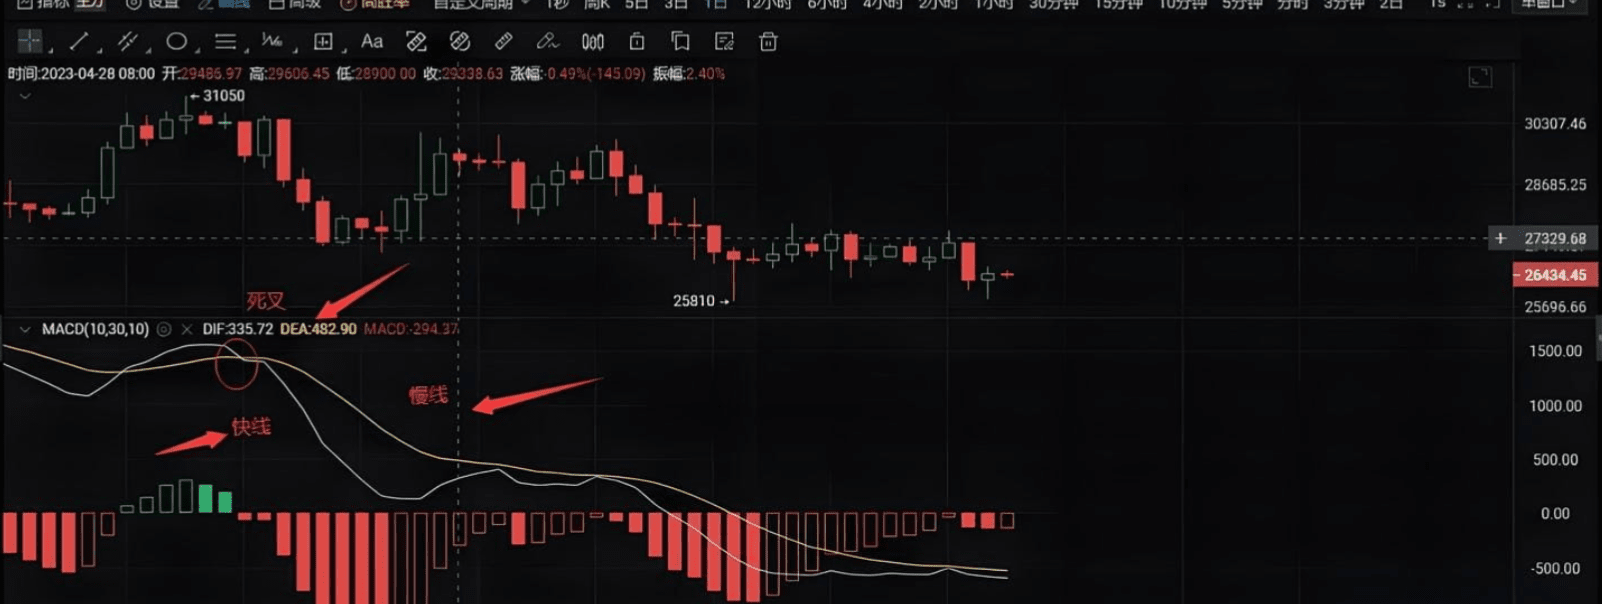
Structure of the MACD indicator:
Consists of two curves and a set of histogram lines; the fast line is the DIF line, and the slow line is the DEA, which can also be abbreviated as fast F and slow A.
Fast F represents the speed of short-term rise and fall, the greater the gap between the two EMA curves displayed, the higher the curve position, indicating a faster rise; the lower the curve position, indicating a faster fall.
DEA is calculated using a smoothing moving algorithm on DIF, representing the average DIF value over a period; DEA serves as an auxiliary judgment line for DIF.
The fast line's data source is the moving average, and the moving average's data source is the closing price, which is a secondary processing of moving average data;
The slow line's data source is the fast line, which is equivalent to a tertiary processing of moving average data;
The MACD is obtained by subtracting the slow line from the fast line and multiplying by 2.
The histogram line is also called the MACD line, and the practical technique lies in:
When the MACD is above the zero axis, the speed of increase accelerates, or the speed of decrease slows down;
When the MACD is below the zero axis, the speed of increase slows down, or the speed of decrease accelerates;
And these rules are:
1. Trends are characterized by acceleration,
2. The gravitational reversion near the zero axis; once the histogram line deviates too far from the zero axis, it must return.
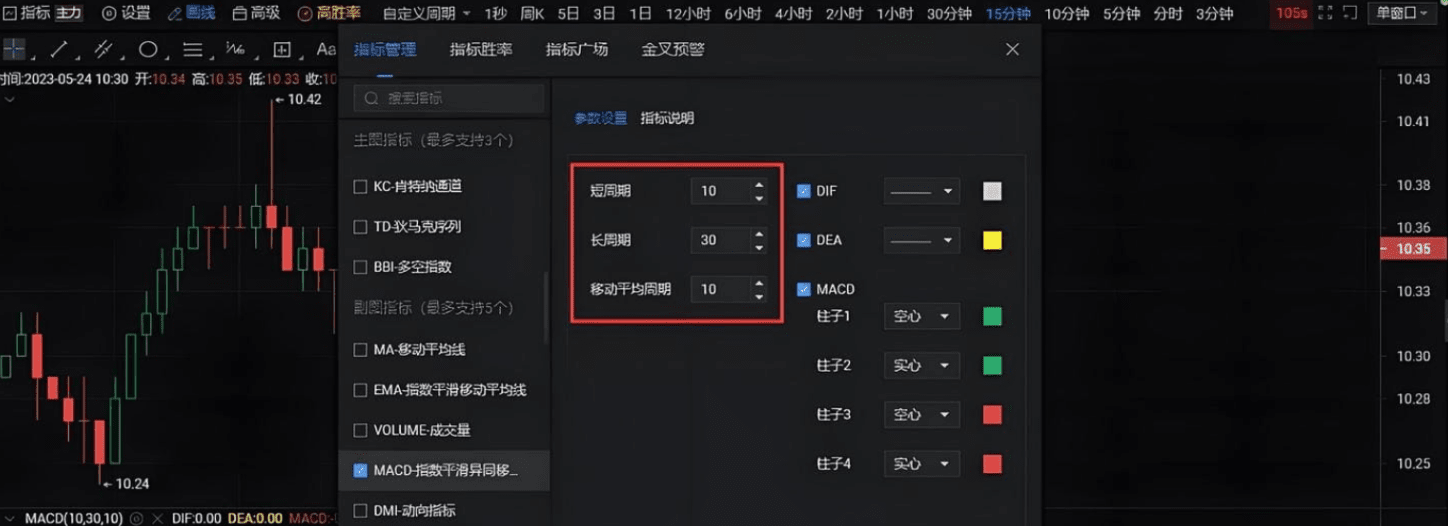
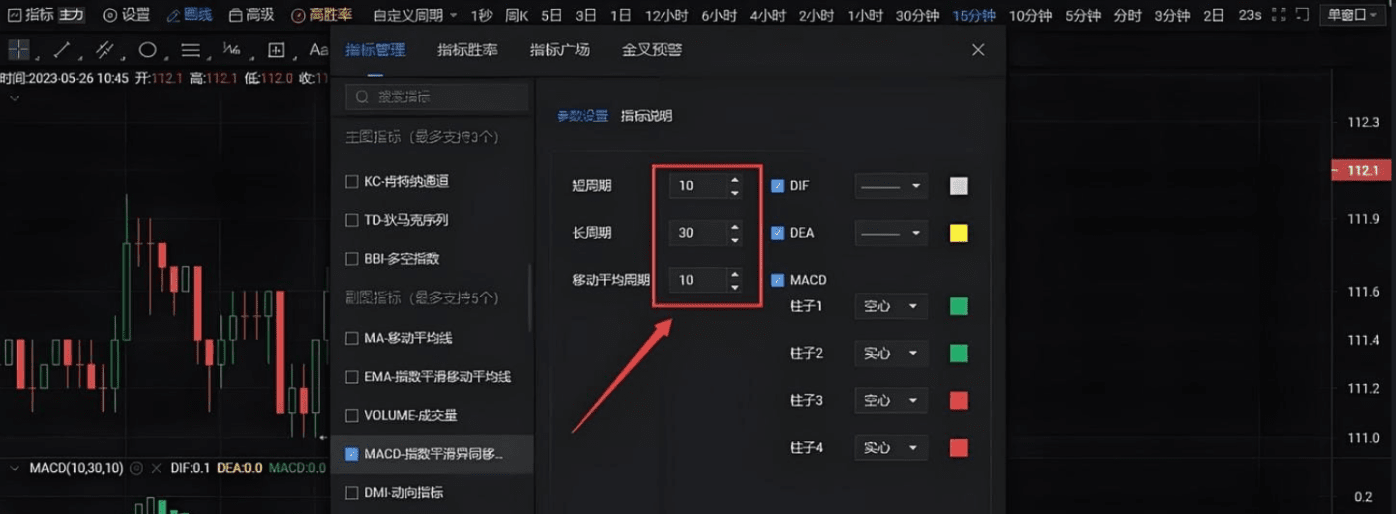
MACD settings:
With this one setting, you can defeat the 99% of analysts who use MACD analysis in the market.
The cryptocurrency market is traded 24 hours a day, 365 days a year. MACD originates from traditional financial markets, and its default setting has market closing periods, so if you do not set it, the accuracy probability will be greatly reduced, especially for long trading periods.
If you grasp more subtle details of the market than others, your conclusions will be more accurate than others, thereby increasing your probability of success.
Synchronous operation, observing divergence, only trading in markets you can understand;
Trading, that's all.
The MACD technical indicator can only serve as one of the references and auxiliary indicators in our practical process; this is key, and we should not mythologize it through a single technique.
It's like I use candlestick charts to get a big picture of the market, determine bull or bear markets, and assess stages.
We can clearly judge which specific stage the overall market trend is currently in, whether it is in a bull or bear market. Which stage of the bull or bear market is it in? Based on the level, is the current market trend upward, downward, or consolidating?
If I give an 80-point conclusion on the market, then to further improve the accuracy of my judgment, I will need more technical indicators for assistance.
Add 5 points for the MACD indicator, 5 points for Western technical analysis, Bollinger Bands, volume, and other indicators; the higher you go, the harder it becomes to add points.
If these indicators are all in sync, the probability of success in operation will be greatly increased.
This is also the real reason for building a trading system that belongs to oneself.
We must understand the principles of specific indicators, keep them in mind, and only then will we be able to apply them skillfully, increasing the probability of correctness.
Subsequently, I will specifically discuss practical applications of the golden cross and death cross at various stages of the market, rather than the so-called methods of buying at golden crosses and selling at death crosses.
Professionalism creates value; details determine success or failure.
If you feel helpless or confused while trading in the cryptocurrency sphere, I hope my sharing can inspire and help you! Cryptocurrency investors, whether beginners or experts, will gain not only financial benefits but also growth in investment knowledge and experience from me.
In the investment process of all iron powder enthusiasts, we will not only provide investors with analysis ideas, basic knowledge of market observation, and various investment tools usage methods, but also bring you wonderful fundamental interpretations, sorting out the chaotic international situation, and identifying various investment forces. Let you become both a winner and an expert in investment! As I always say, if you don’t know how to operate in a bull market, click on Awen's avatar, follow for bull market spot planning, contract codes, and free sharing.$BTC $ETH $BNB #ETH创历史新高 #美联储降息预期 #币安Alpha上新


