Cryptocurrency technical expert 'Charting Guy' believes that XRP's daily chart has turned into a clear case study of Elliott Waves. He considers the recent rebound to be a corrective bounce rather than an impulsive one, and it may signal a deeper C wave correction, ultimately dropping towards the August low. In a post on X, he wrote: 'The rebound from $2.72 to $3.38 in August is a corrective rise of wave 3, unlike the impulsive rise of wave 5 in other currencies, so I see it as wave B. In the coming days/weeks, we are likely to return to the August low, and the C wave will conclude the correction that began in late July.'
The XRP correction has not yet ended.
The annotated chart (XRP/USD) depicts an evolving five-wave sequence, with the first and second waves completing in May and June, the vertical peak of the third wave extending through mid-July, while the ABC waves are unfolding, ultimately forming the fourth wave. The A wave starts from the peak of the third wave, the B wave rebounds to $3.40, and the expected C wave drops to a Fibonacci cluster coinciding with the August low. At the time of the snapshot, XRP's daily closing price was approximately $3.02881, between the 0.786 and 0.888 retracement lines.
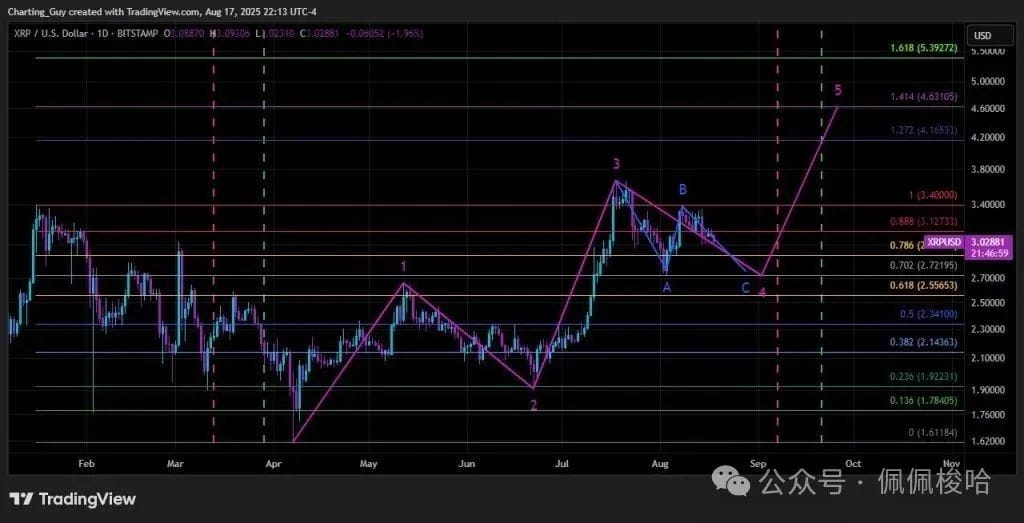
The Fibonacci sequence occupies most of the chart and defines the key levels for the analyst to trade. The drawn retracement and extension steps are as follows: 0 is at $1.61184, 0.136 is at $1.78405, 0.236 is at $1.92231, 0.382 is at $2.14363, 0.5 is at $2.34100, 0.618 is at $2.55653, 0.702 is at $2.72195, 0.786 is at $2.87293, 0.888 is at $3.1273, and 1.000 is at $3.4000.
Above the previous highs, the upward extension levels mapping the future fifth wave are located at $1.272 ($4.16533), $1.414 ($4.63105), and $1.618 ($5.39272). The B wave stalled below the resistance level of $3.1273 to $3.4000 ($0.888 to $1.000), reinforcing this area as the upper limit that the market must break through to confirm the completion of the retracement.
Conversely, the proposed C wave termination zone is anchored by the 0.786–0.702–0.618 stack, located at $2.87293/$2.72195/$2.55653, with the pivot from August particularly highlighted around ~$2.72.
The magenta trend line sloping down from the peak of wave 3 divides ABC in half, with the expected path pushing prices into the position marked as '4', followed by a sharp rise to achieve a new uptrend.
The terminal '5' mark is almost exactly located at the 1.414 extension near $4.63105 - consistent with the author's own statement that this represents a conservative target area - and if momentum delivers excessively, the 1.618 print at $5.39272 constitutes a clear extension target.
When asked about the higher target price of $8 he previously set within the community, the analyst responded, 'Did the post mention that the $8 target price would no longer be set?' When asked if the price would continue to rise in November, he replied, 'Maybe, maybe.' Regarding positions, he warned, 'Even if it seems likely to drop, it does not guarantee that it will definitely drop,' and added, 'In my view, holding... utilizing options, futures, or spot trading for short-term gains.'
The direct interpretation is clear: unless XRP can recover and stay above $3.1273 and $3.4000, Charting Guy's roadmap leans towards retesting the August bottom around $2.72195 to complete the fourth wave. Only after such a spike (or a decisive failure through the resistance) will his schematic open the door for the next impulsive fluctuation, targeting $4.16533 to $4.63105, with $5.39272 reserved for the extended fifth wave by the end of September or early October.
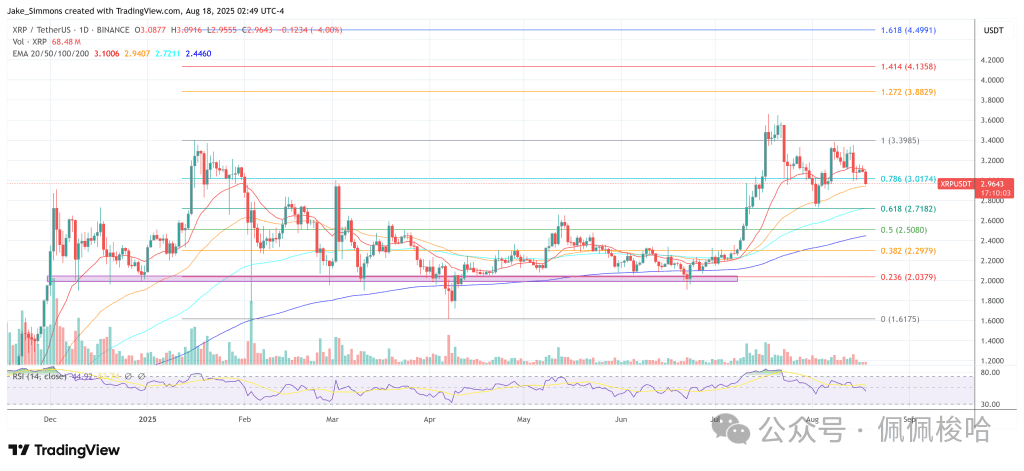
As of the time of writing, the trading price of XRP is $2.96.