
1. Fundamentals: Inflation data fluctuations intertwined with geopolitical uncertainties
This week's market volatility is closely related to the release of inflation data. On Tuesday, the US CPI inflation data for July fell short of expectations, indicating a halt in the upward trend, directly heating up the market's expectations for a rate cut in September. As a result, the US dollar index began to decline continuously, breaking below the 98 mark, while non-US products surged significantly; in the risk asset domain, Bitcoin and Ethereum continued to rise and hit new highs.
However, market sentiment shifted on Thursday. The PPI data for July released that day exceeded expectations, signaling a potential rebound in future inflation, which pushed the US dollar index back above the 98 mark, while Bitcoin and Ethereum both entered a downward mode.
Meanwhile, the highly anticipated 815 Alaska "Putin meeting" ended abruptly in just three hours. The two sides engaged in dialogue regarding the Ukraine issue, but ultimately did not reach any significant agreements. This geopolitical uncertainty may enhance the safe-haven sentiment for crypto assets, introducing new variables to the market.
2. Technical analysis: The trends of mainstream cryptocurrencies are diverging, and adjustment pressure is becoming evident.
BTC: Short selling pressure increases, downtrend is obvious
Bitcoin's weekly chart shows a long upper shadow bearish candlestick and has broken below the 7-day moving average support. In the short term, the support below needs to closely watch the early month's low at the 112K line, which coincides with the 14-day moving average and holds significant support meaning.
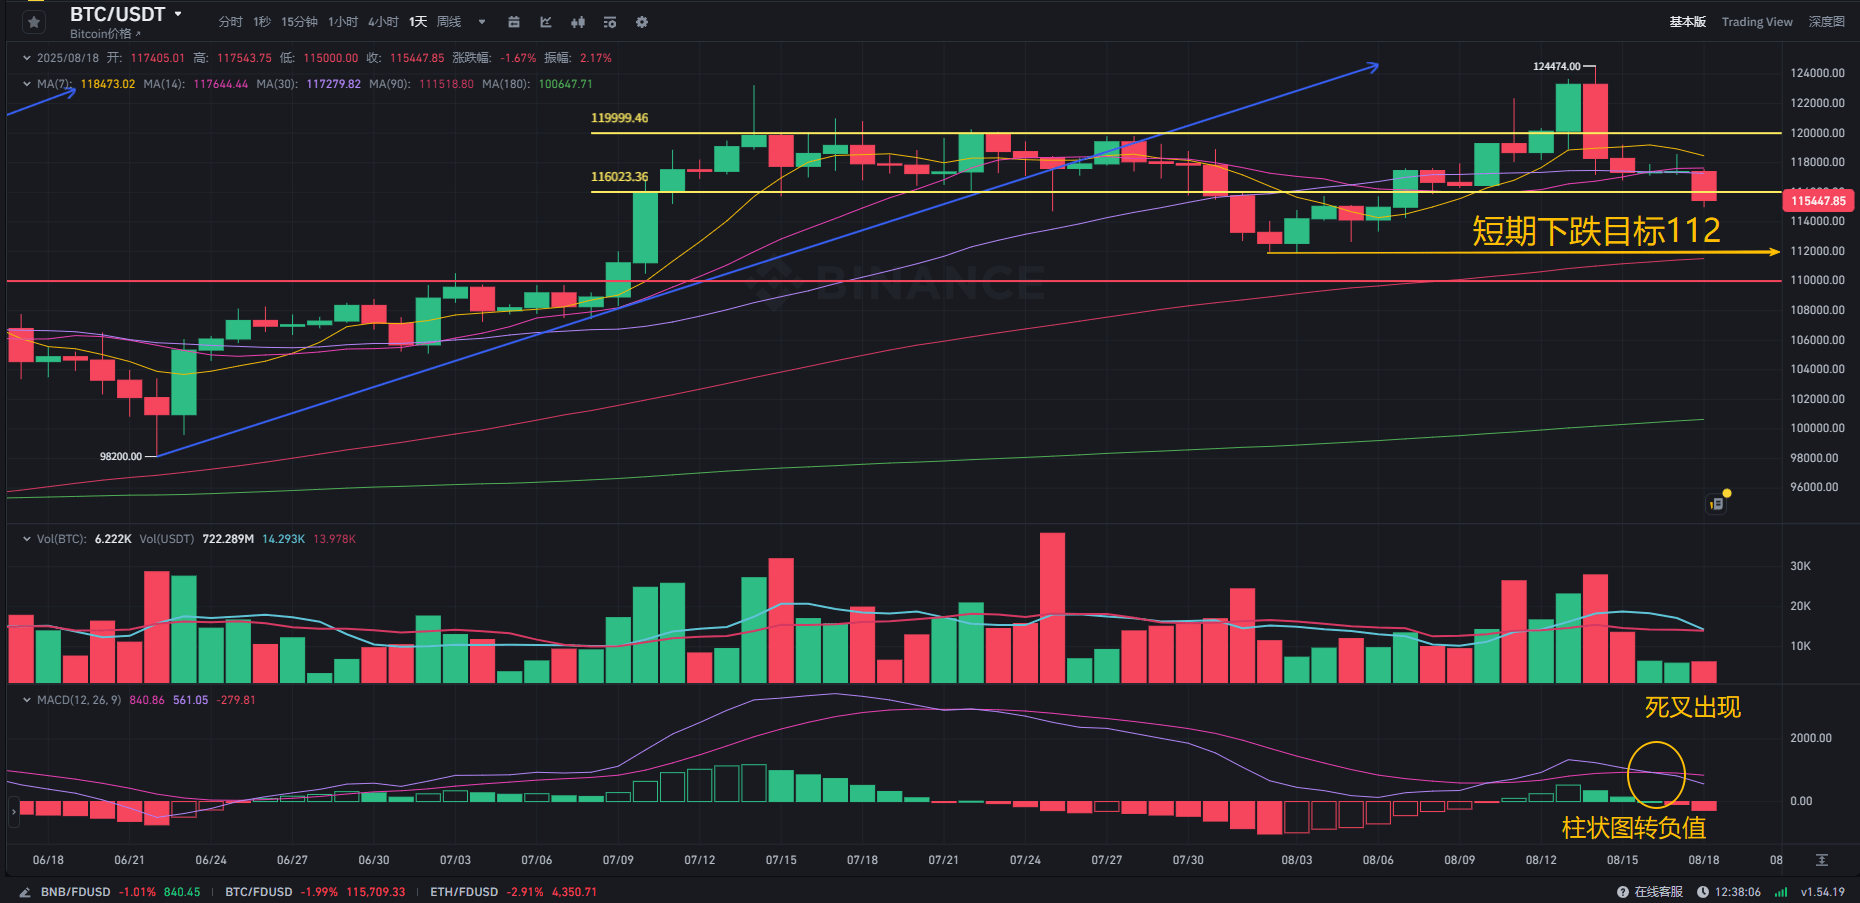
On the daily chart, Bitcoin experienced a rise followed by a fall last Thursday, closing with a large bearish candlestick accompanied by increased trading volume. This indicates heightened market risk aversion and gradually increasing selling pressure. The slight rebound over the weekend is unlikely to last, and this morning saw a rapid and substantial decline, breaking below the short-term support at the 116K line.
The MACD indicator has formed a death cross, with the momentum histogram turning negative, indicating that short sellers are beginning to dominate the market. However, the fast and slow lines remain above the 0 axis, suggesting that short sellers have not fully taken control. In summary, based on the daily chart's trend, there is still room for further declines in the subsequent market, with the short-term target first looking at 112K; if this position is broken, then further look towards the 110-107 support range.
The 4-hour chart shows that Bitcoin was in a low-volume adjustment state over the weekend, accompanied by a slight rebound. It has now closed with a large bearish candlestick, presenting a downtrend with increased volume. The initial focus today is on the 114 support line; if this support fails, then look to the area around 113.
ETH: Entering a high-level correction phase, tug-of-war between bulls and bears continues
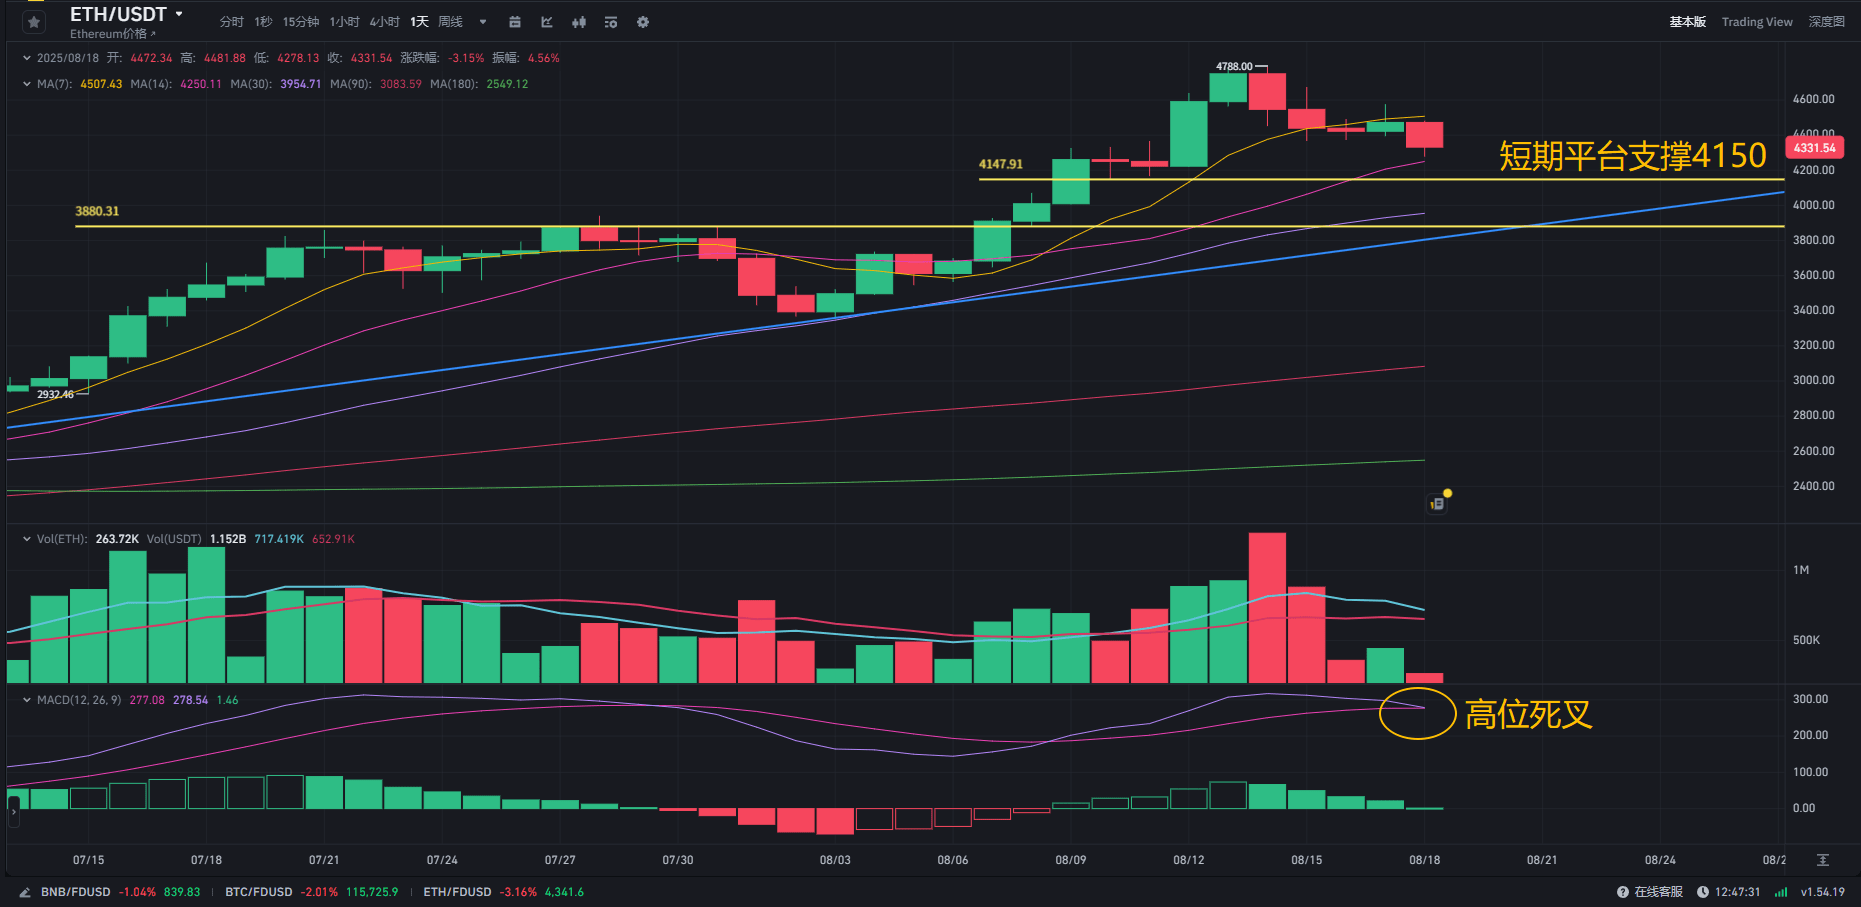
Ethereum started from 2111 points in late June, rising to a peak of 4788 points, showcasing a standard main upward wave. The larger trend remains within an upward channel, but it has now entered a high-level correction phase, with momentum significantly weakening.
Throughout the upward process, a platform has formed near the 4150 line recently, which serves as an important short-term support level for the current market. The support below is around the 3880 line, which can act as a second defense line.
The MACD indicator formed a death cross after high divergence, and the histogram began to turn negative, indicating that short selling pressure is gradually increasing. However, the fast and slow lines remain above the 0 axis, suggesting that short sellers have not fully occupied the market.
The maximum increase of Ethereum in this round reached 126%, which is substantial, and the likelihood of entering a significant downturn in a short time is low. Before the trend reverses, there must be a phase of high-level profit-taking, during which the market will repeatedly rebound and peak near the top.
If the subsequent market can rebound after touching around 4150, it is expected to continue rising towards 4680 in the short term. Whether it can enter a new upward trend again depends on whether the Federal Reserve will cut interest rates in September.
From the 4-hour chart, Ethereum is currently undergoing a small third wave downward trend, forming three peaks at 4780, 4680, and 4580. In today's operations, focus on short opportunities as it rebounds to the 4360-4400 range, while also watching support at the 4260-4220 range.
3. Altcoins: Risks and opportunities coexist, focus on key sectors
Ethereum's exit from the staking queue reached 855,158 coins this Friday, setting a new historical high. The rapid accumulation of unlocked volume has become an important factor in Ethereum's recent correction. Due to the discounted nature of staking derivatives and liquidity risks, this may lead to chain liquidations and spot selling pressure.
Ethereum staking-related tokens have seen significant increases last week, but have faced considerable correction space in recent days. Additionally, this week, tokens such as FTN, ZRO, and ZK will experience large unlocks, and investors should be cautious about risk prevention.
The total locked value (TVL) of Ethereum L2 has risen to 45.19 billion USD, primarily concentrated in tokens such as ARB, BASE, OP, and ZK; the RWA sector's TVL has surpassed 13.418 billion USD, indicating that these two sectors have recently concentrated funds and activities, which should be key focus areas going forward.
Currently, the altcoin market's sustainability is poor, and market participation is weak. The next focus is on whether Ethereum can re-challenge the 4700 level; if successful, altcoins may welcome a wave of catch-up opportunities.
(Note: The cryptocurrency market is highly volatile, invest cautiously. This article is merely personal opinion, not financial advice, and is for sharing purposes only.)


