I. Fundamentals: Inflation data 'rollercoaster' + rising geopolitical risk aversion, causing extreme fluctuations in market sentiment.
1. Inflation data acts as a 'switch' for bulls and bears, with US dollar index fluctuations driving cryptocurrency direction.
This week, the cryptocurrency market was repeatedly pulled by inflation data: Tuesday's US July CPI did not meet expectations and stopped rising, while expectations for a rate cut in September pushed the US dollar index below 98, leading Bitcoin and Ethereum to continue reaching new highs; however, on Thursday, the July PPI skyrocketed by 3.3% year-on-year, exceeding expectations, suggesting a possible rebound in inflation, causing the US dollar index to rebound back above 98, directly triggering a collective decline in mainstream coins, highlighting the 'immediate control' of macro data over the market.
2. The Alaska 'Putin Meeting' ended without results, raising geopolitical risk aversion.
The globally monitored 815 Alaska dialogue ended hastily after only three hours, with no significant agreements reached regarding the Ukraine issue. The uncertainty in geopolitics may drive some capital towards cryptocurrencies seeking refuge, but in the short term, it is more likely to manifest as cautious market sentiment.
II. BTC Technical Analysis: The weekly long upper shadow exposes fatigue, with 112K being the short-term lifeline.
Trend reversal signals and target calculations
This week, the BTC weekly chart shows a long upper shadow bearish candle, breaking below the 7-day moving average support, with clear technical adjustment signals:
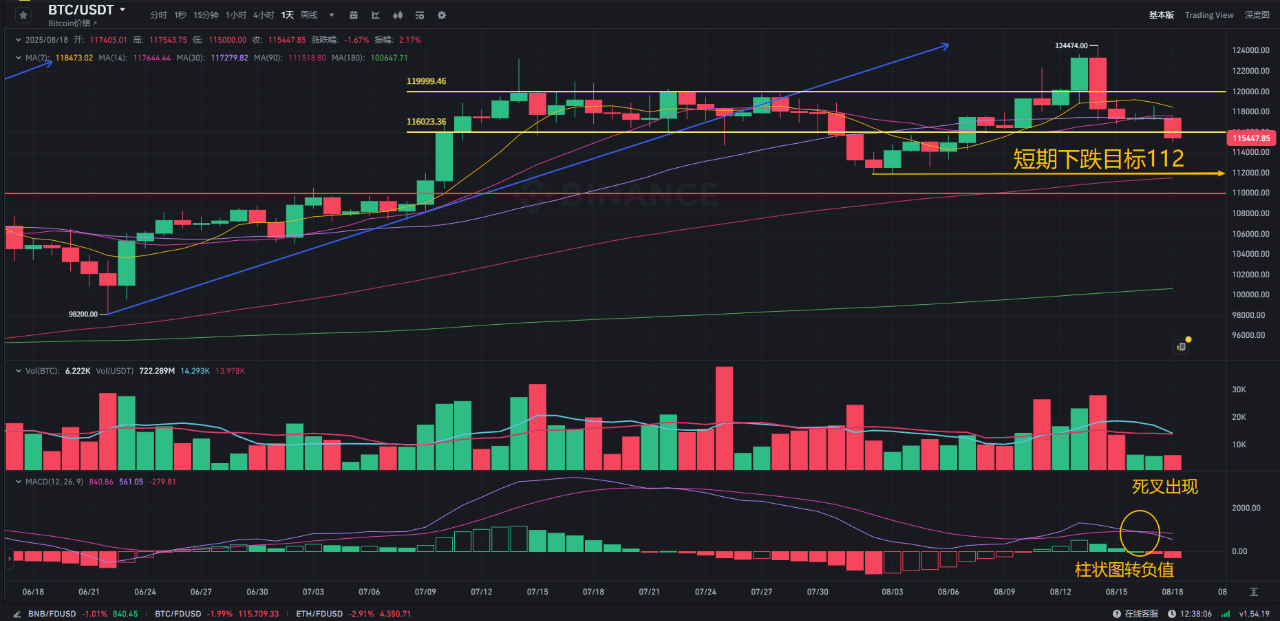
Daily breakout: Thursday saw a spike and retreat, closing with a large bearish candle and increased trading volume. After a slight rebound over the weekend, it experienced a significant drop this morning, losing the 116K short-term support, with continued bearish selling pressure being released;
Indicator warning: The MACD forms a death cross, with momentum bars turning negative, as bears begin to dominate the market, but the fast and slow lines remain above the zero axis, indicating that bears have not fully taken control, and adjustments may show a stepwise downward trend;
Support and targets: The short-term first support is aimed at 112K (early month low + 14-day moving average); if broken, a drop to the 110K-107K range is expected, as this area is a previous high-volume trading zone with strong defense.
4-hour rhythm and intraday strategy
The 4-hour chart shows a volume contraction rebound followed by a significant drop, forming a large bearish candle. Today, first watch the 114K support; if lost, further tests near 113K may occur, with operations focused on short trades during rebounds, avoiding blind bottom-fishing.
III. ETH Technical Analysis: The main upward wave pauses for adjustment, with 4150 as the key defense.
Characteristics of high-level adjustments and subsequent opportunities
ETH has entered a high-level correction phase after rising from $2111 in late June to $4788, completing a standard main upward wave with a 126% increase:
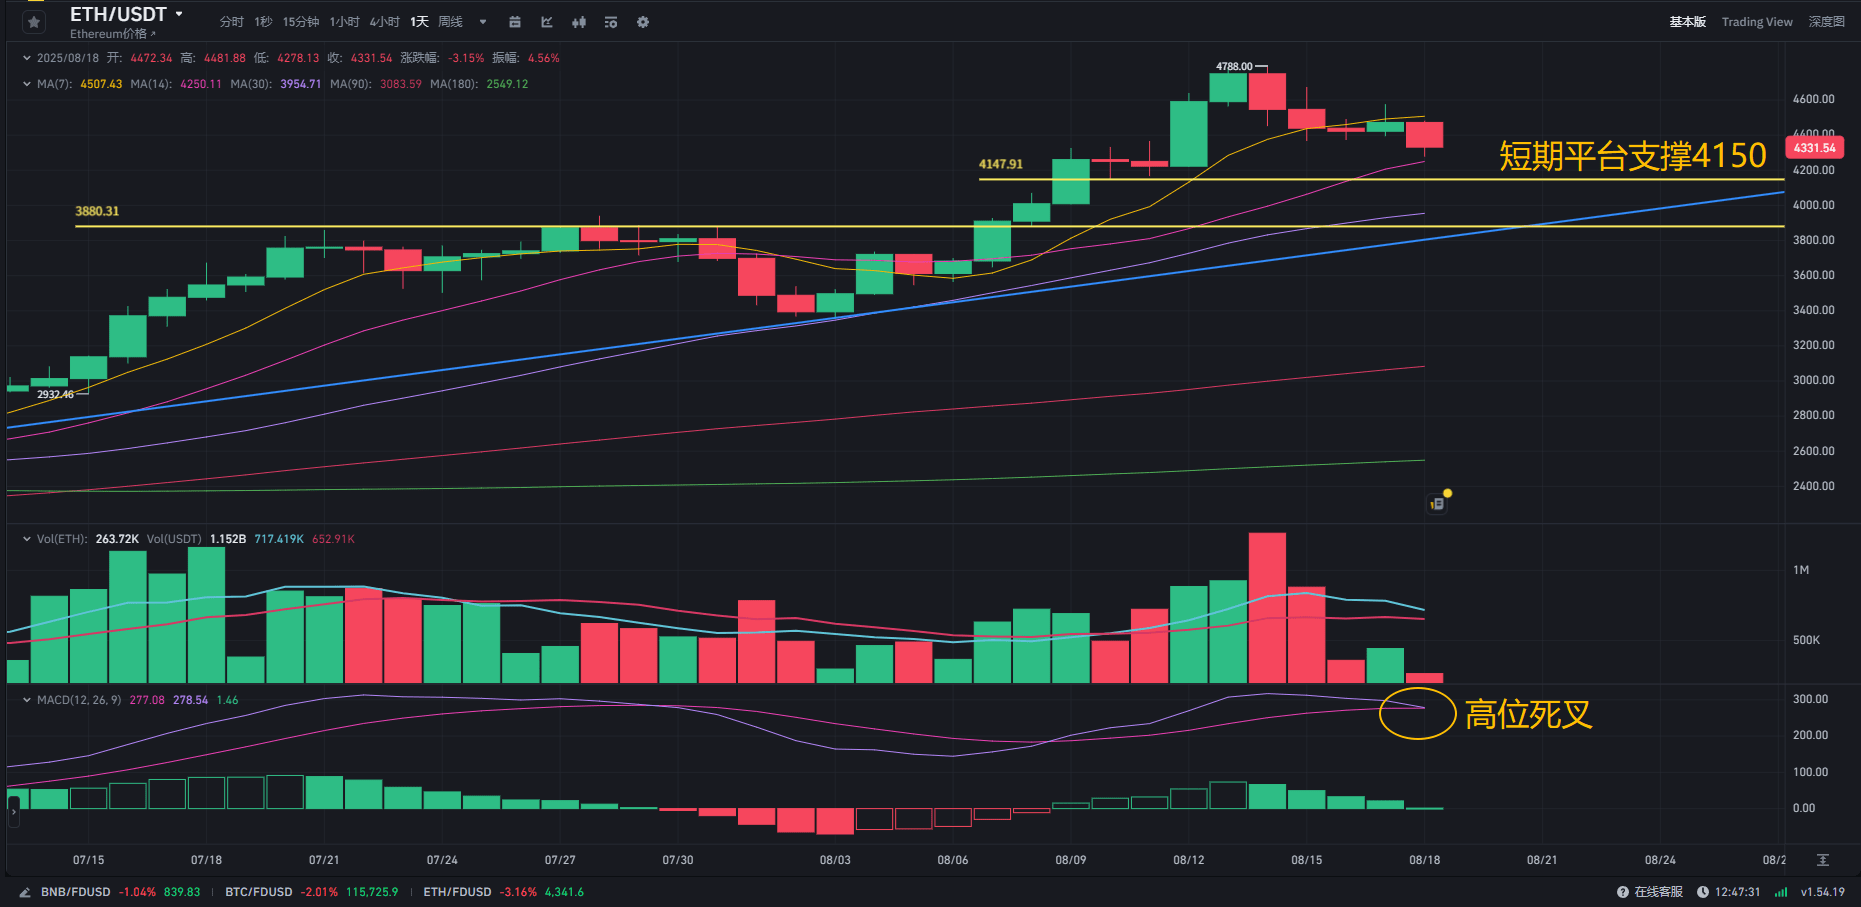
Support structure: Short-term important support at 4150K (recent platform consolidation level), with the lower channel line at 3880K as the second defense line. If these two positions can stabilize, it may trigger a rebound;
Indicators and volume: After a high-level divergence, the MACD formed a death cross, with momentum bars turning negative, and bearish selling pressure intensifying, but the fast and slow lines above the zero axis indicate that the short-term has not completely turned bearish;
Market nature: The probability of a direct crash after a significant rise is low; before reversing the trend, a high-level distribution phase must be experienced, accompanied by multiple spikes and pullbacks. If a rebound occurs near 4150K, there is a short-term expectation for another challenge at 4680K; whether a new market trend opens depends on the outcome of the Fed's rate cut in September.
4-hour structure and intraday operations
The 4-hour chart shows a small three-wave decline, with highs of 4780→4680→4580, indicating a clear downward structure. Today, focus on the 4360-4400 resistance zone to position short trades, with support seen in the 4260-4220 range.
IV. Altcoins: Staking pressure release and unlocking risks compound, with L2 and RWA becoming safe havens.
Short-term risks and medium-term opportunities
Currently, the altcoin market continues to show weakness, and two major risks must be heeded:
Staking pressure release impact: The ETH staking withdrawal queue reached 855,158 this Friday, a record high. Risks of liquidation due to the discount on staking derivatives and liquidity concerns may trigger a chain of forced liquidations, with related tokens (like LDO, ETHFI) experiencing expanded pullbacks;
Unlocking pressure: Tokens such as FTN, ZRO, ZK will see significant unlocking this week, requiring caution against selling pressure that may weigh on sector sentiment.
Key directional focus worth noting
Despite short-term pressure, both major sectors have high capital concentration, worthy of focus:
ETH L2 Ecosystem: Total locked value (TVL) rises to $45.19 billion, with leading assets like ARB, BASE, OP, ZK showing catch-up potential, waiting for ETH stabilization signals;
RWA Sector: TVL breaks through $13.418 billion, with compliance asset on-chain demand supporting sector resilience, and there may be buying opportunities after a pullback.
Subsequently, it is crucial to monitor whether ETH can make a second attempt to breach $4700; if realized, altcoins are expected to welcome a wave of catch-up rally.
Risk warning: The cryptocurrency market is highly volatile due to macro data and sentiment influences; the above analysis is merely personal opinion and does not constitute investment advice. Operations must strictly control positions and stop losses.#加密市场回调


