
XRP is holding steady above an important price level after a period of strong volatility. According to Glassnode data, $2.81 has become a critical support area, where investors have accumulated nearly 1.7 billion tokens.
Another significant supply density can be observed at the $3.26 level, where over 1.05 billion tokens have been purchased. Meanwhile, a much smaller amount, only about 2.9 million tokens, has been accumulated in the narrow range of $3.57 to $3.58. These figures highlight the importance of certain levels in determining the market's future direction.
Supply Density and Market Behavior
The cost basis distribution heatmap from Glassnode shows that accumulation at specific price levels helps form support and resistance areas. These zones tend to help traders better understand where demand may increase or decrease during market fluctuations.
Thus, the high token concentration around the $2.81 mark indicates that this area may still be a key point determining price stability. A prolonged drop below this level could jeopardize XRP's upward momentum, and positions above this level would reinforce the bullish trend.
Alongside accumulation patterns, trading momentum is also weak. According to CoinGlass, XRP derivatives have seen a 44% drop in trading volume and an 82% decrease in open contracts. These declines often indicate reduced speculative activity and short-term loss of momentum.
This pullback has not affected market performance. XRP has delivered a pretty good annual return, over 50%, far exceeding Bitcoin. Last year, this coin increased by more than 237%, making it even more attractive to investors despite the volatility.
However, the failure to maintain the upward momentum from the recent July has dampened hopes. This coin continues to trade 15% lower than its all-time high of $3.67, recorded earlier this summer. The precarious nature of the current structure is reflected in the price temporarily dropping below the critical level of $2.81, as was the case on August 2.
Deeper technical analysis has emerged from the chart shared by market analyst Ali on X. He points out that XRP is beginning to form a triangle pattern, with the price fluctuation range becoming narrower as it reaches the peak. According to him, breaking through the resistance level of $3.26 could trigger a price surge up to $3.90.
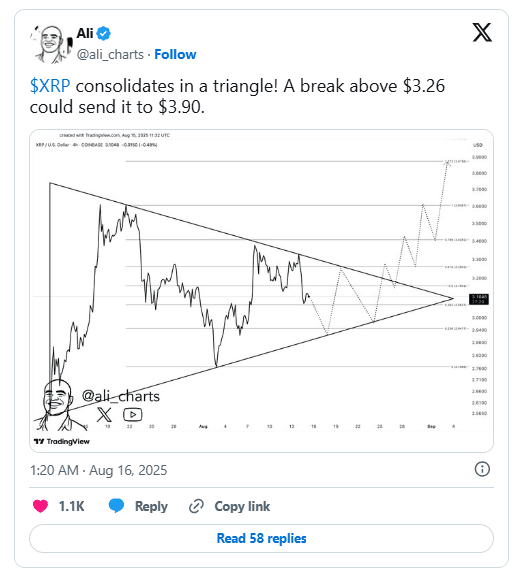
This forecast aligns with Glassnode's observation of a strong supply cluster at the $3.26 level, implying that breaking through this price threshold could generate significant momentum. The chart also indicates fluctuations in the pattern may occur before a decisive move, which is why monitoring short-term resistance and support levels is crucial.
Outlook for Traders and Investors
Support and resistance groups, indicated by supply density, along with technical patterns such as the triangle model, can be used to make decisions in the coming weeks.
With strong buying pressure concentrated around the $2.81 and $3.26 levels, traders are currently watching whether XRP can maintain its upward momentum above these critical zones to sustain a broader bullish structure.
