
At the time of writing, XRP is up less than 1% in the past 24 hours but still down 16.5% for the month. Despite a strong July, the altcoin continues to signal short-term bearishness.
Strong whale activity, EMAs about to confirm another death cross, and key price thresholds all being threatened. All three of these factors suggest a potential for short-term declines – especially for traders looking for opportunities in the next wave of volatility.
Whales Simultaneously Push Tokens to Exchanges
Whale inflows to Binance have once again started to increase after remaining low since August 13. On that day, inflows to the exchange reached approximately 29,805 XRP, and immediately after that, the price of XRP fell from $3.27 to $3.08.
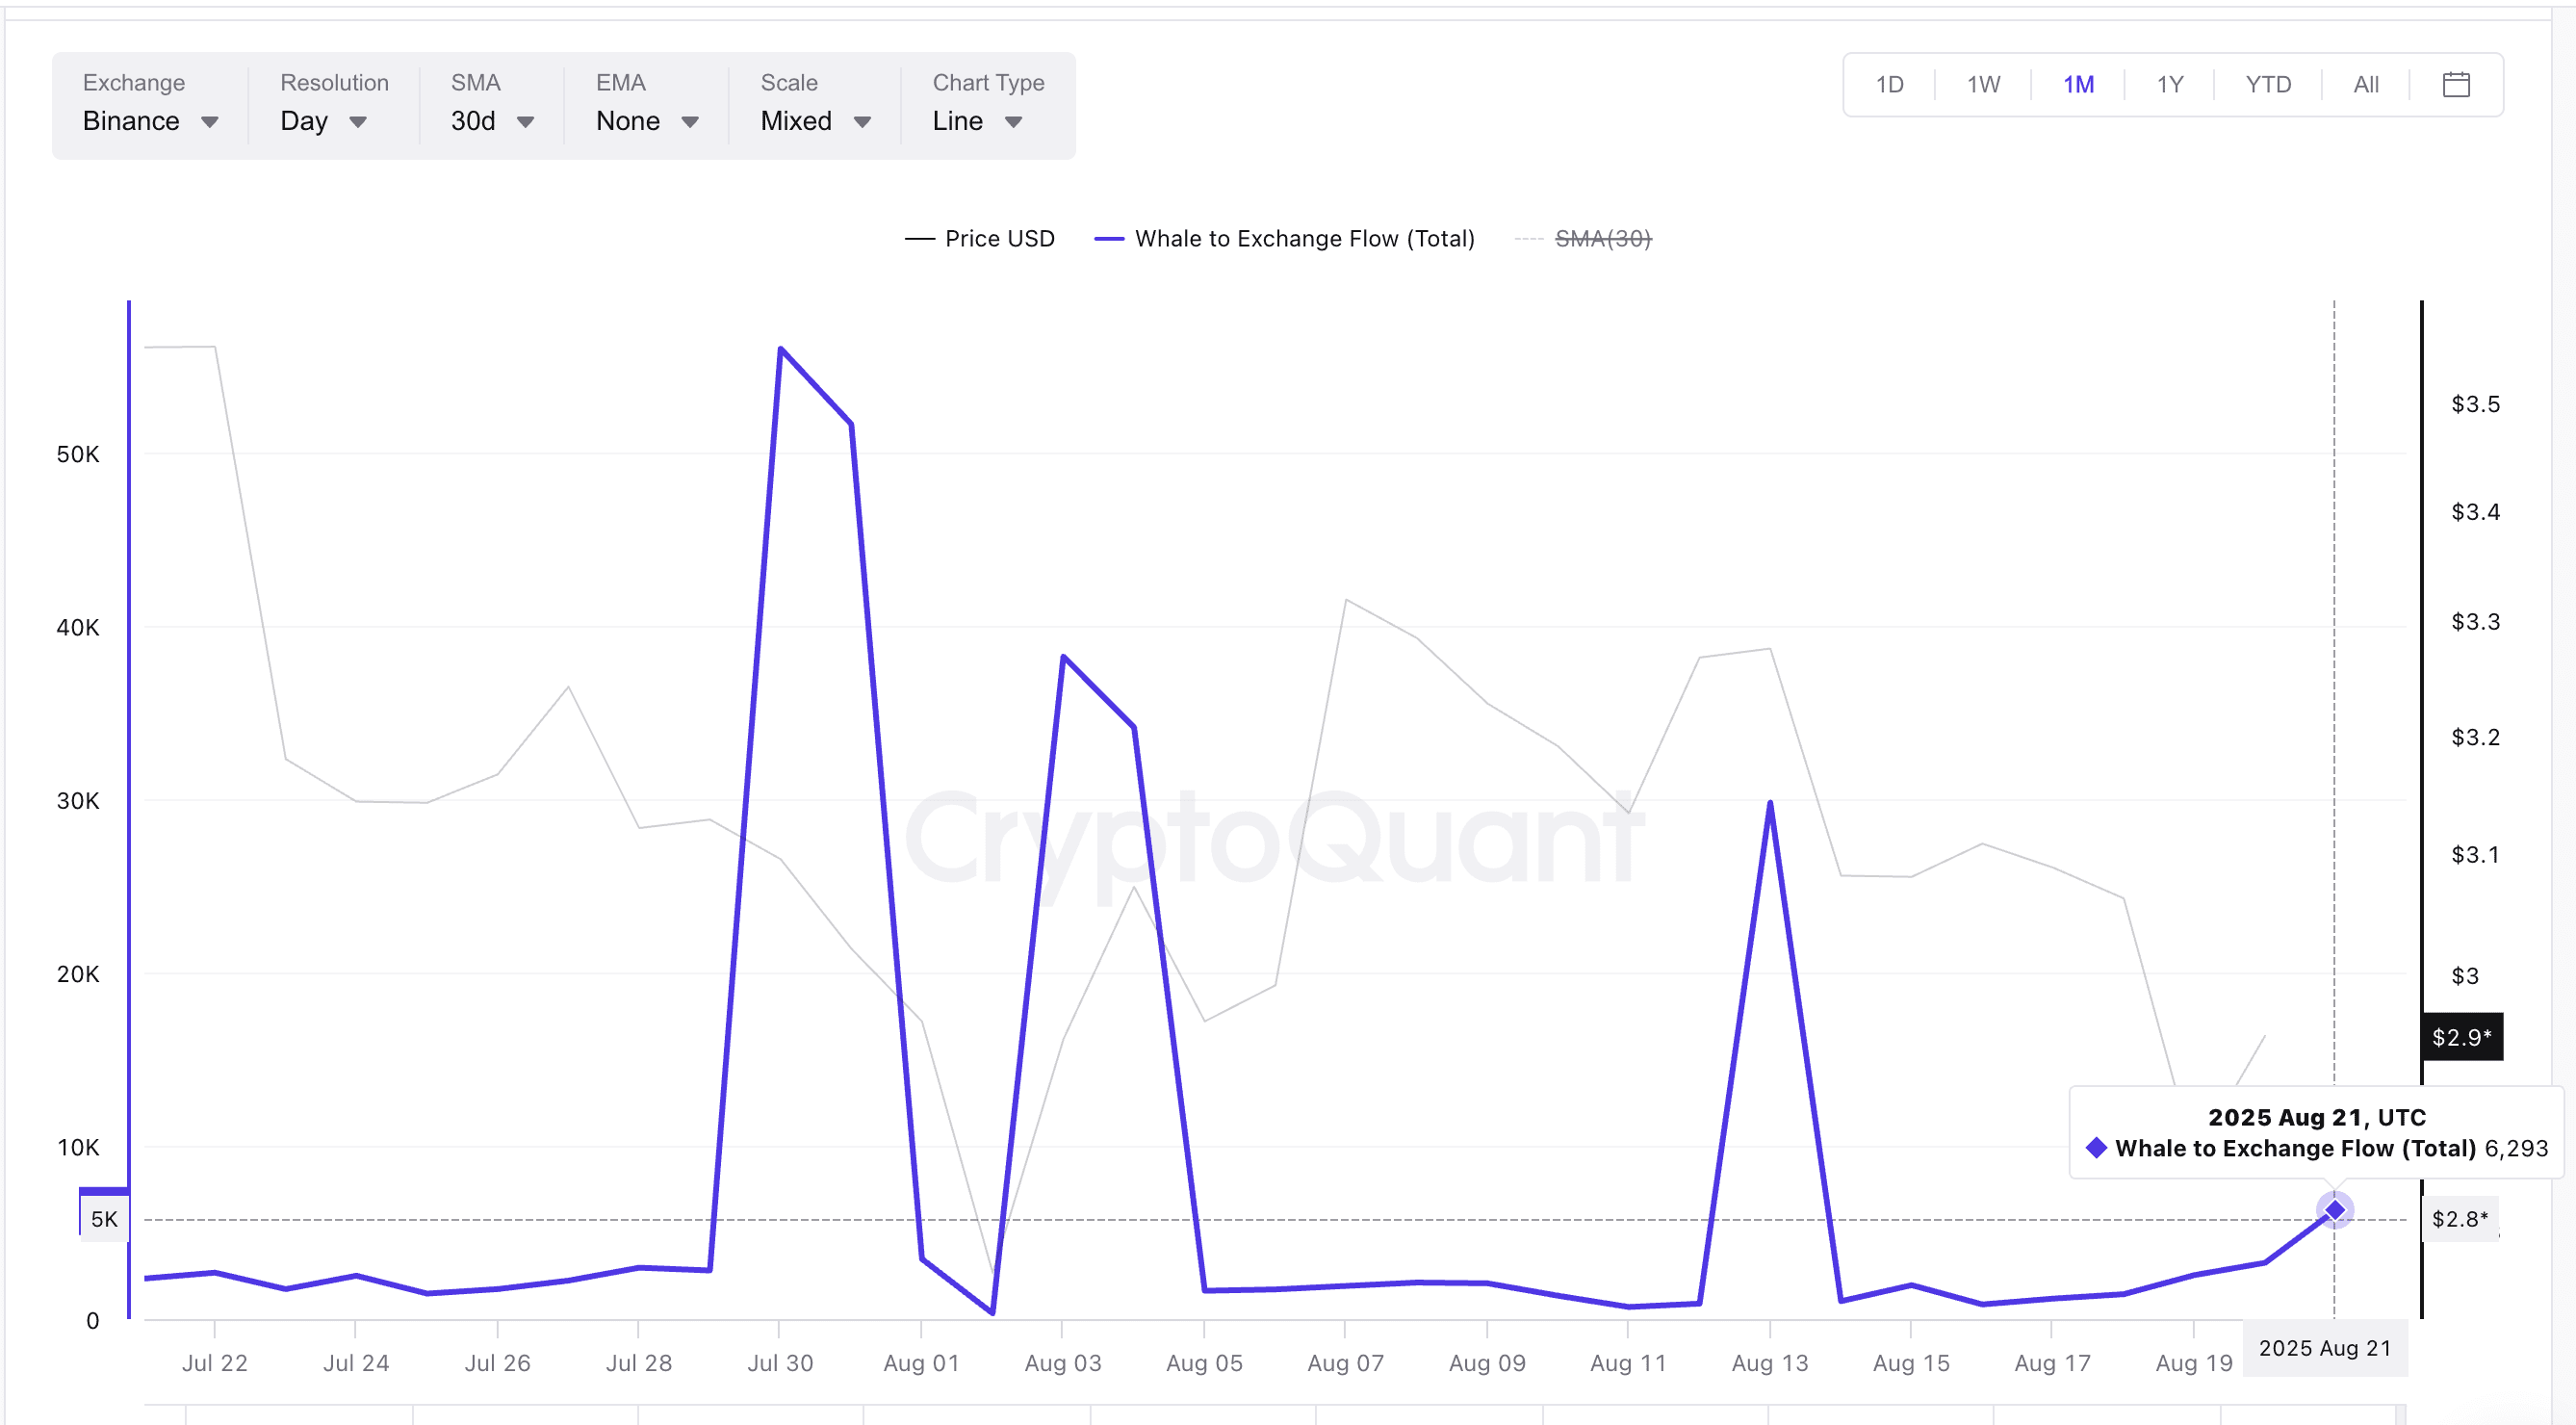
Whale-to-Exchange Flow is an indicator used to track the volume of tokens that whales transfer to centralized exchanges – often a signal of their intention to sell.
As of August 21, whale deposits have increased 7x from the local low on August 16, from 900 XRP to 6,293 XRP. Historical data shows that these spikes often lead to a subsequent price decline. Specifically, when inflows spiked on July 30, the price dropped from $3.09 to $2.76; and on August 3, the price dropped from $3.07 to $2.96 in the following days
If this new increase exceeds the August 13 threshold, it will mark a new peak in whale inflows – something that has never been recorded in this declining market phase. At that time, selling pressure is likely to increase, exerting pressure in the short term.
XRP to Record 3rd “Death Cross”
XRP's 4-hour price chart shows bearish momentum forming rapidly. Two death crosses from the EMAs have been confirmed (red arrows) and a third cross is gradually appearing.
An EMA death cross occurs when a short-term moving average crosses below a long-term moving average, often signaling a trend reversal. If the third cross is formed, the XRP price chart will have three bearish patterns in less than a week.
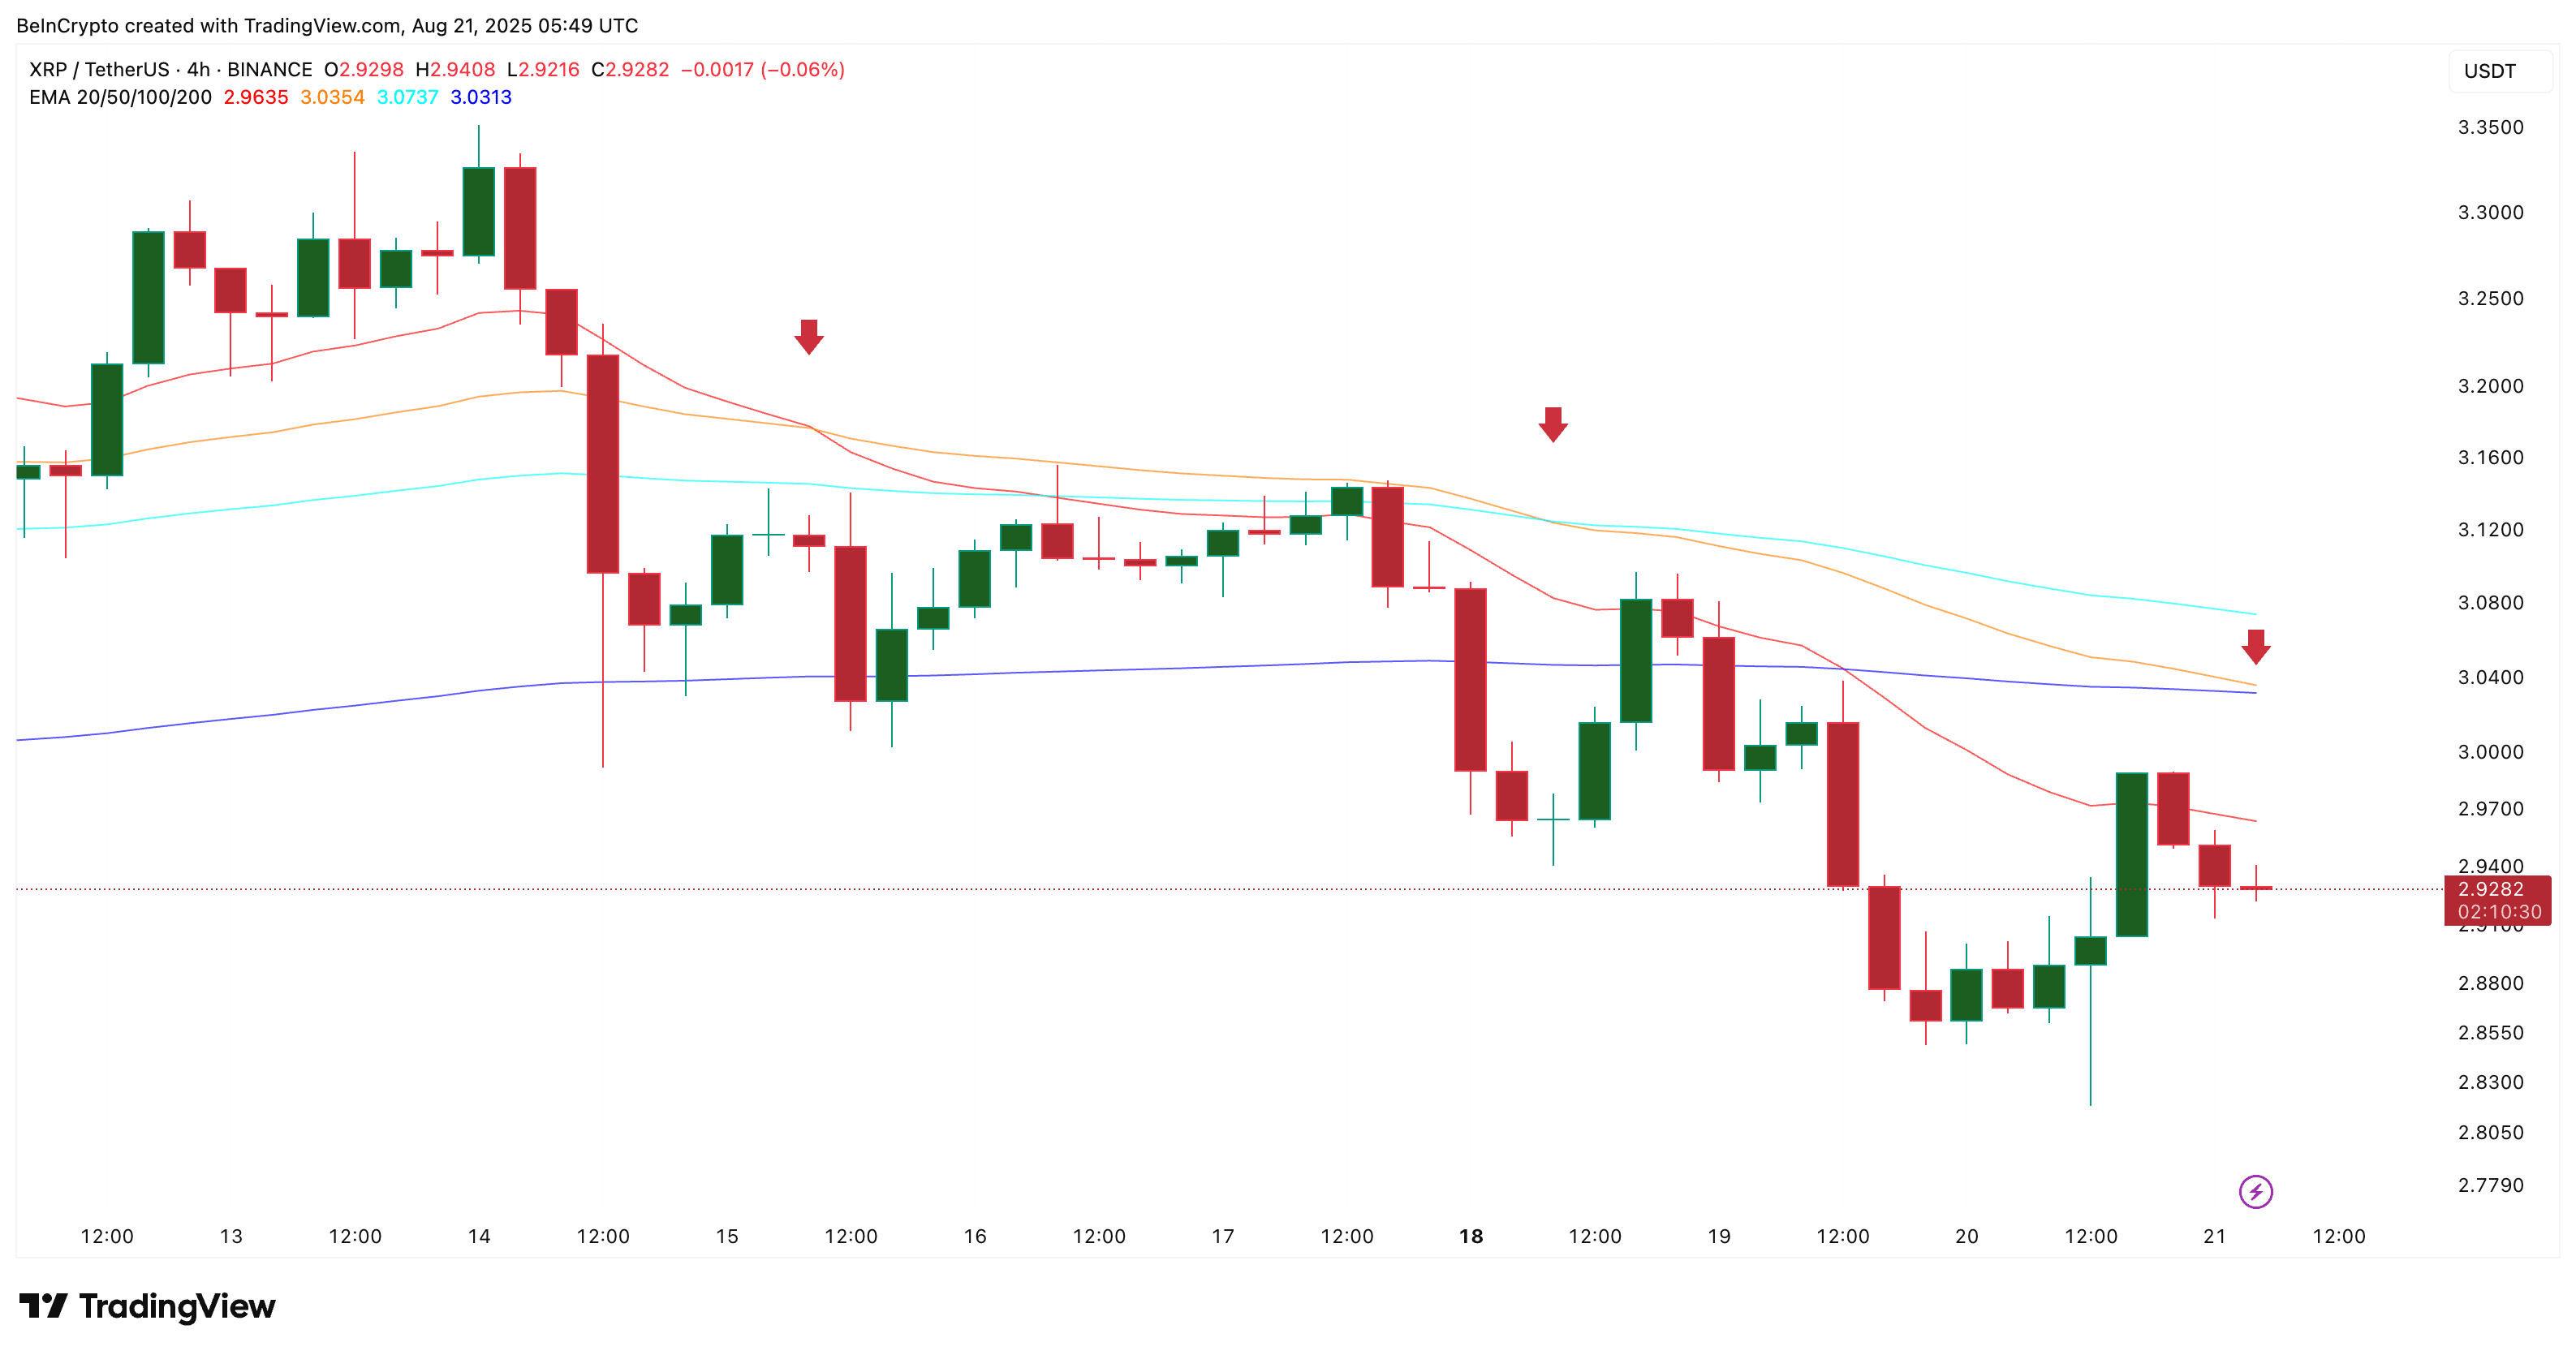
Each previous death cross was accompanied by a sharp decline:
August 15 (EMA 20 crosses EMA 50): price drops from $3.12 to $2.93
August 18 (EMA 50 crosses EMA 100): price drops from $3.03 to $2.93
The third death cross – which occurs when the EMA 50 crosses below the EMA 200 – is considered much more important because it reflects a broader trend change, not just short-term weakness. When whale inflows are also increasing sharply at the same time, the bearish EMA setup further reinforces the potential for price declines. This pattern shows that short-term sellers are increasingly dominant, coinciding with selling pressure from whale dumps.
Important Price Thresholds to Watch
The daily chart shows XRP continuing to struggle around the $2.95 Fibonacci level. XRP has retested this level at times but failed to turn it into a support zone.
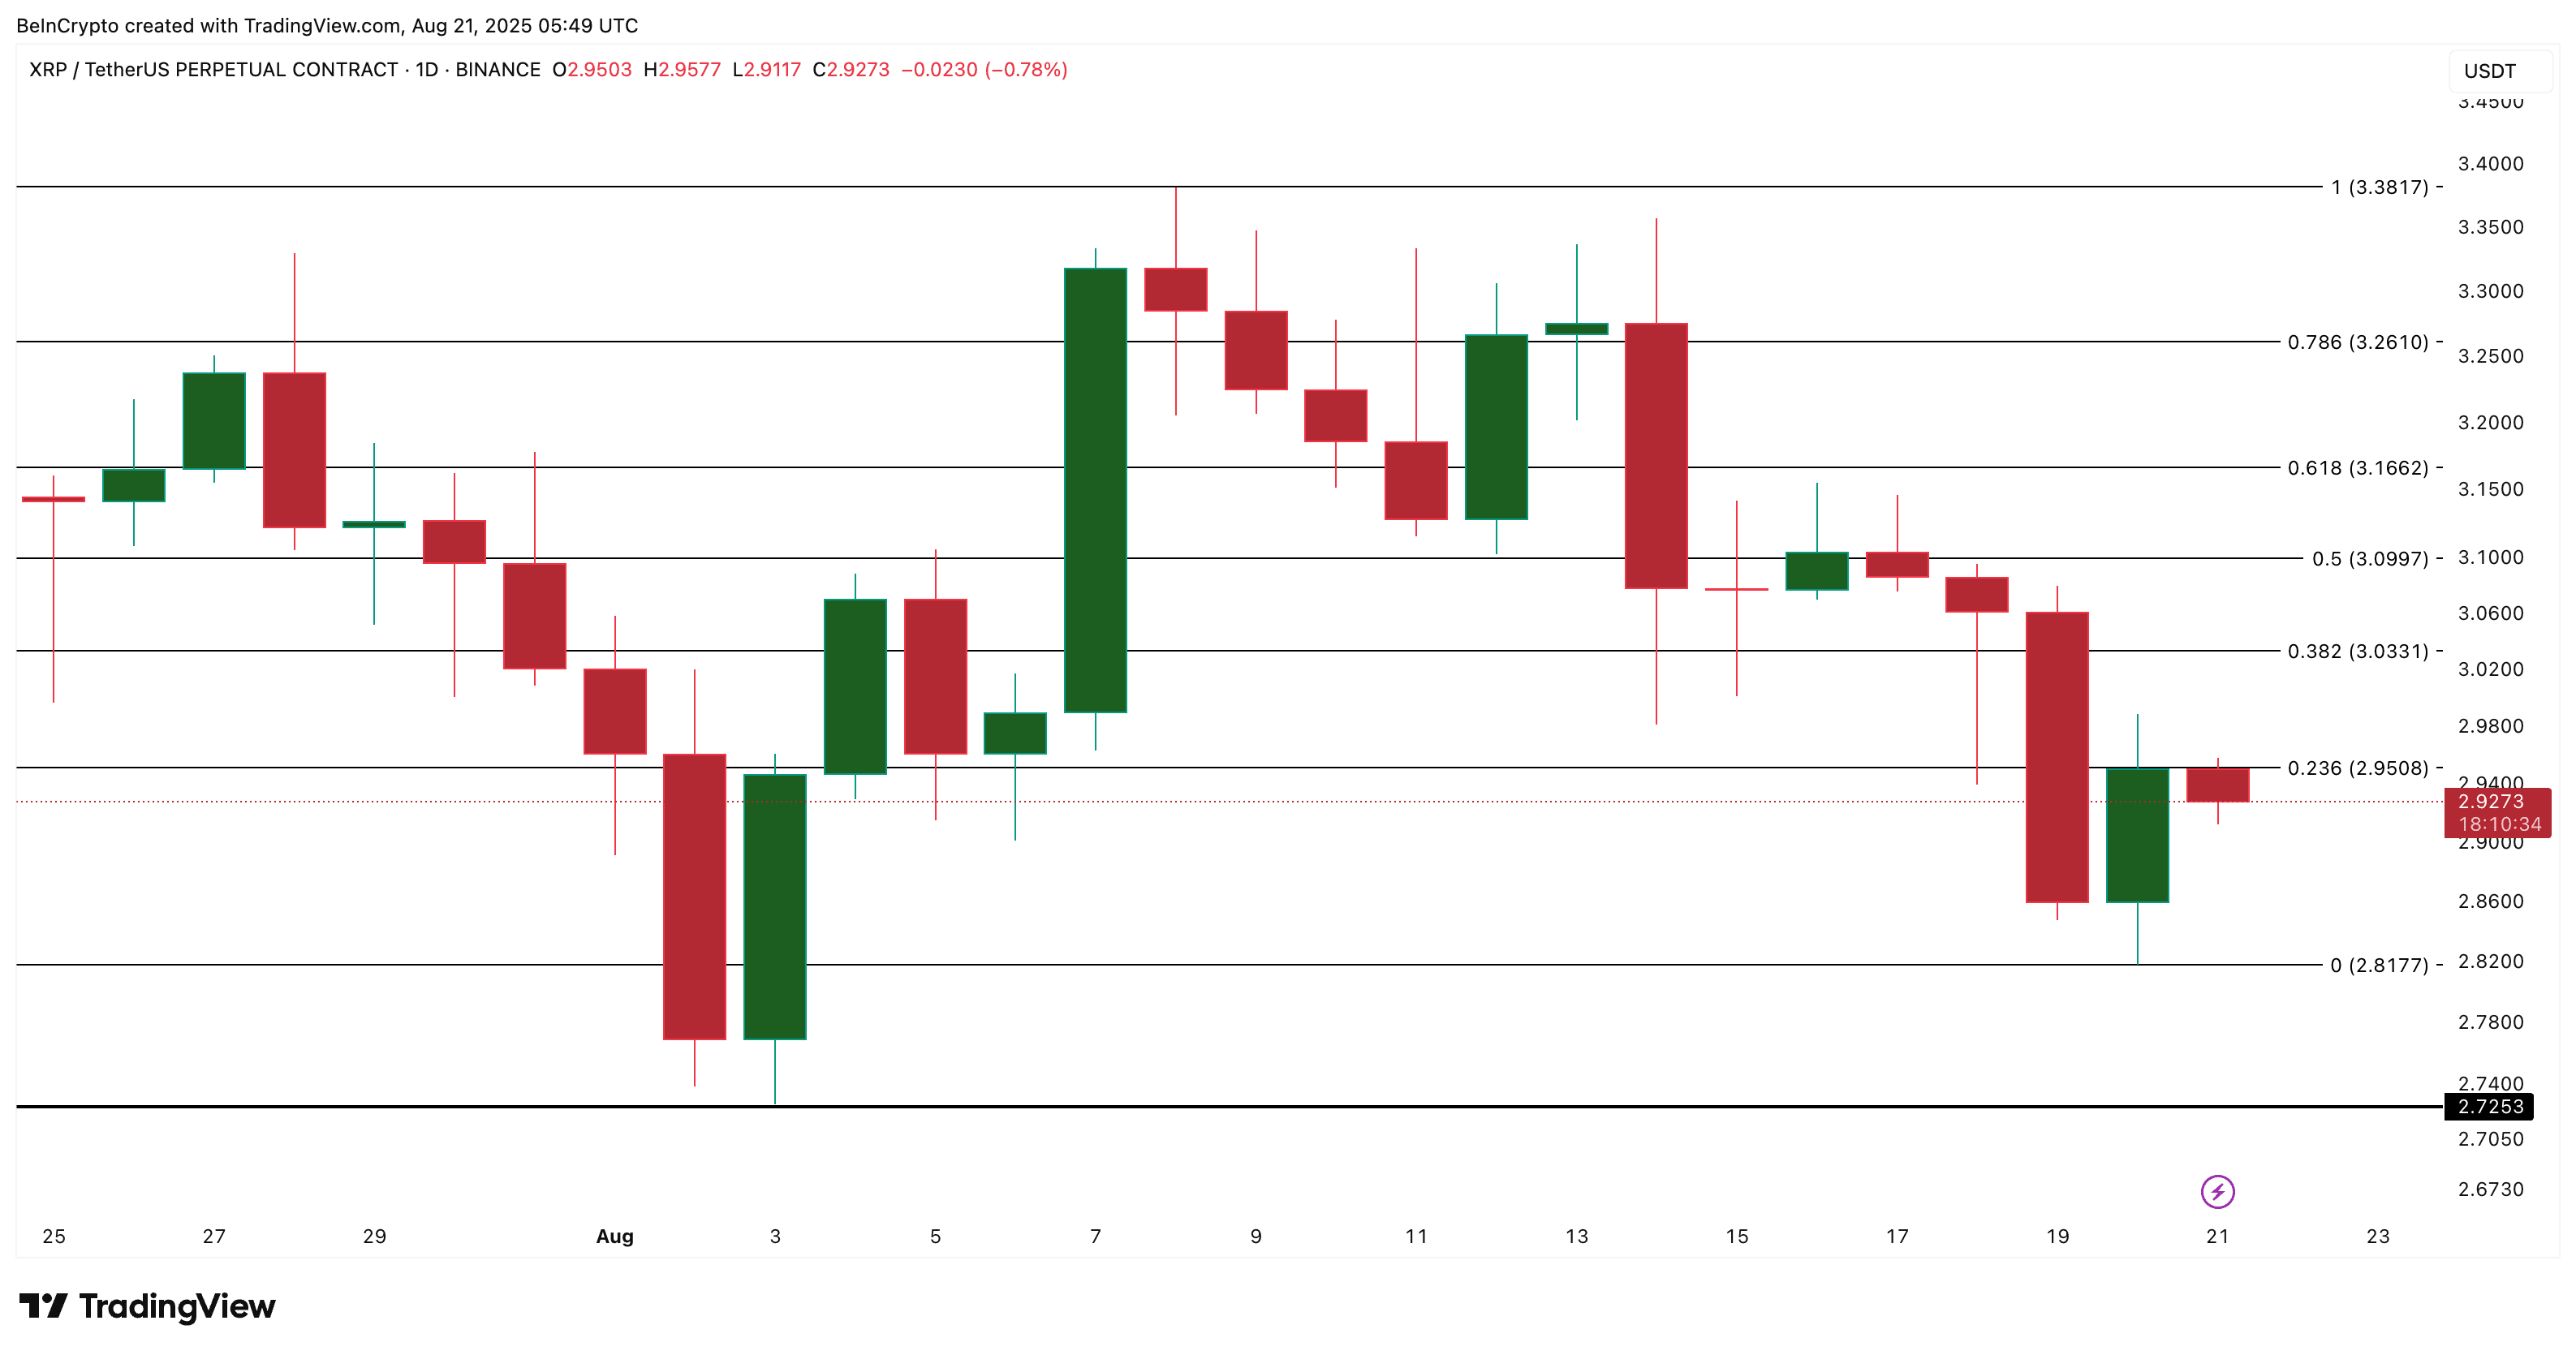
The next important support level is at $2.81 – previously a strong reversal zone. If this level is broken, the next downside target will be $2.72, the last support level before the price faces a greater risk of decline.
A recovery is only possible if XRP regains $3.16 – the 0.618 Fibonacci level that acted as resistance for most of August. If this scenario occurs, the short-term bearish outlook will weaken.
