🚨 $BTC
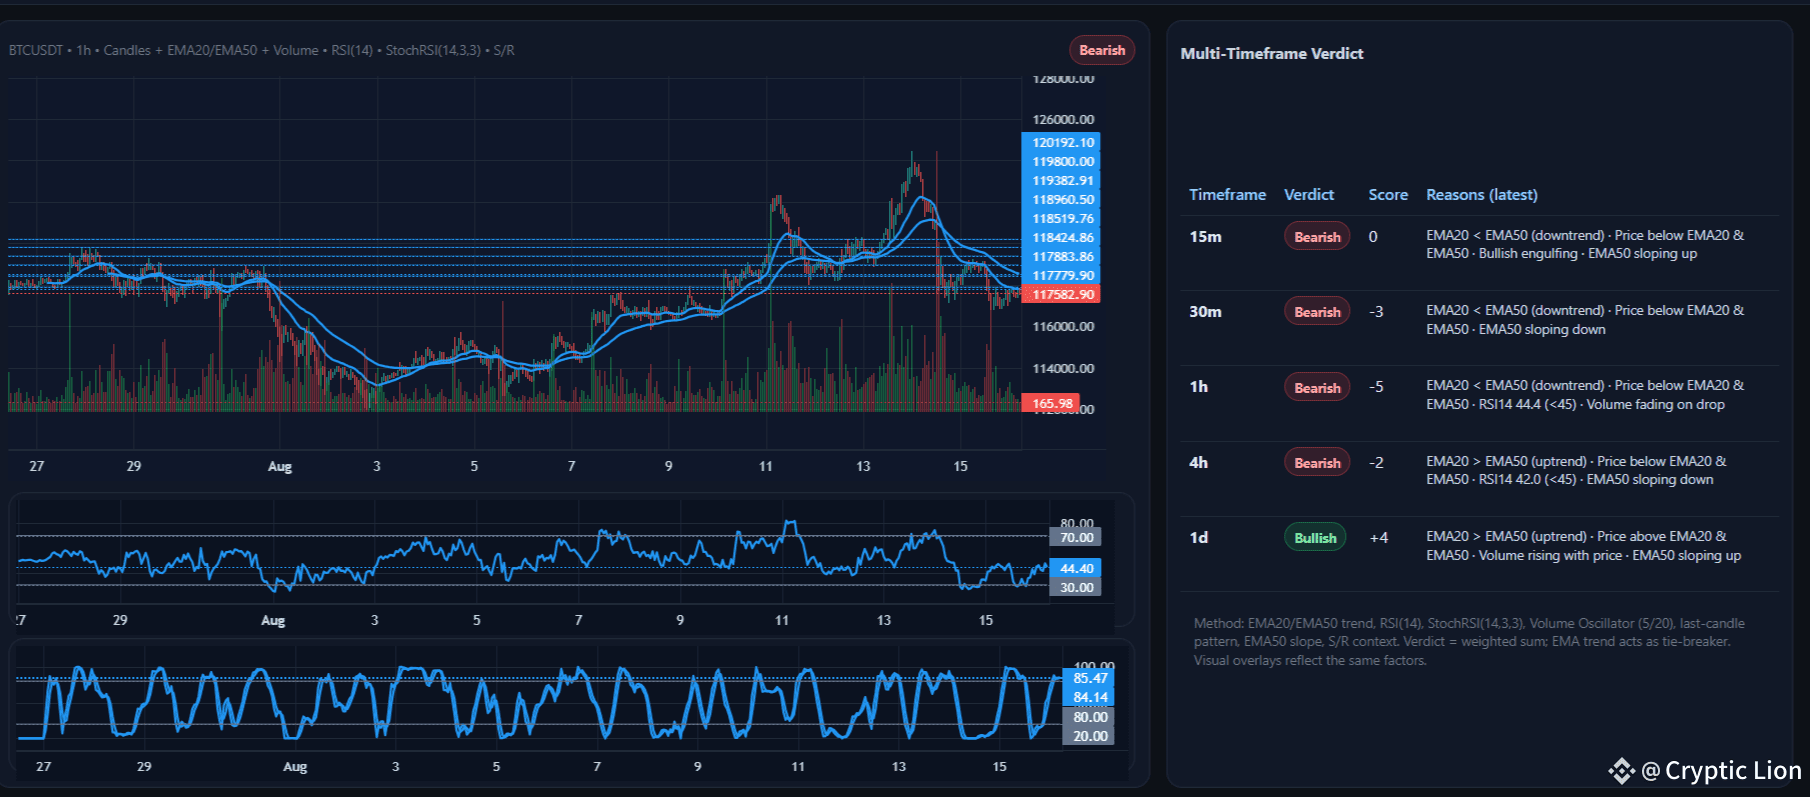
Bitcoin is flashing bearish signals across lower timeframes, despite the daily chart showing some strength. On the 15m and 30m charts, BTC remains below the EMA20 & EMA50, with RSI hovering around 44 (<45) and fading volume. This indicates sellers are still in control. The 1h chart is even clearer, showing a downtrend with EMA20 < EMA50 and a bearish momentum setup.
On the 4h timeframe, while EMA20 sits above EMA50, price is stuck below both moving averages and RSI remains weak (~42). This keeps mid-term pressure intact. The daily chart (+4 bullish) does show signs of recovery, with price holding above EMA20/EMA50 and volume building — but until lower timeframes confirm, the short-term outlook stays heavy.
📊 Trade Setup (Spot Only):
Resistance Zones: $118,500 – $119,300, $120,200
Support Zones: $117,000 – $117,500, next at $116,200
Entry Zone: Only after a confirmed breakout above $118,500 with strong volume
Take Profit (TP1): $119,800
Take Profit (TP2): $120,200
Stop Loss: Below $116,800
👉 For now, BTC remains vulnerable in the short term. Wait for a clear breakout confirmation before entering.