🚨$SOL
Solana is trading in a decisive range, with the 4H timeframe showing a mixed but opportunistic setup. While shorter intervals (15m–1h) are still bearish, the 4H and Daily charts maintain a bullish bias, keeping buyers hopeful for an upside continuation.
📊 Technical Analysis
EMA Trend: On the 4H chart, EMA20 > EMA50, confirming that the medium-term uptrend is intact. However, the EMA50 is beginning to slope down, signaling possible exhaustion unless volume steps in.
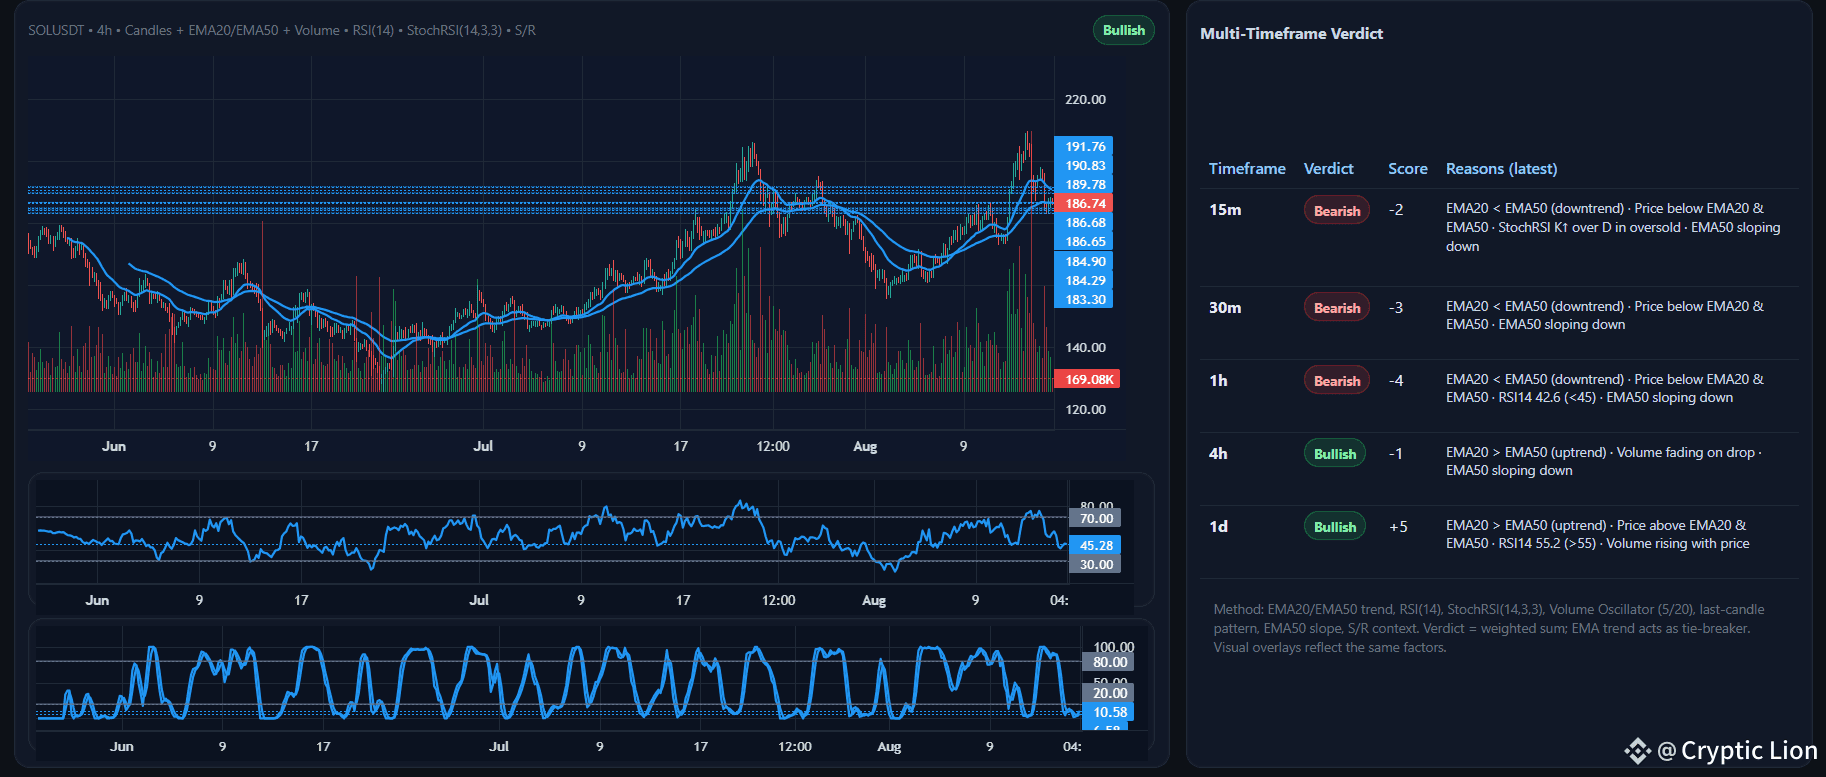
Volume: Recently fading on pullbacks, suggesting weak selling pressure. If buyers return near the breakout, volume confirmation will be key.
RSI (14): Hovering near 42–46 on intraday, but the Daily RSI remains above 55, giving strength to the larger uptrend. This divergence explains the bearish short-term vs bullish higher timeframe split.
StochRSI: Oversold signals on shorter timeframes indicate possible bounce potential, but only a move above resistance validates bullish continuation.
Price Action: SOL faces a heavy resistance cluster around $209–$212, with multiple failed retests. A decisive close above this zone could open the path toward $223 and higher levels around $231.
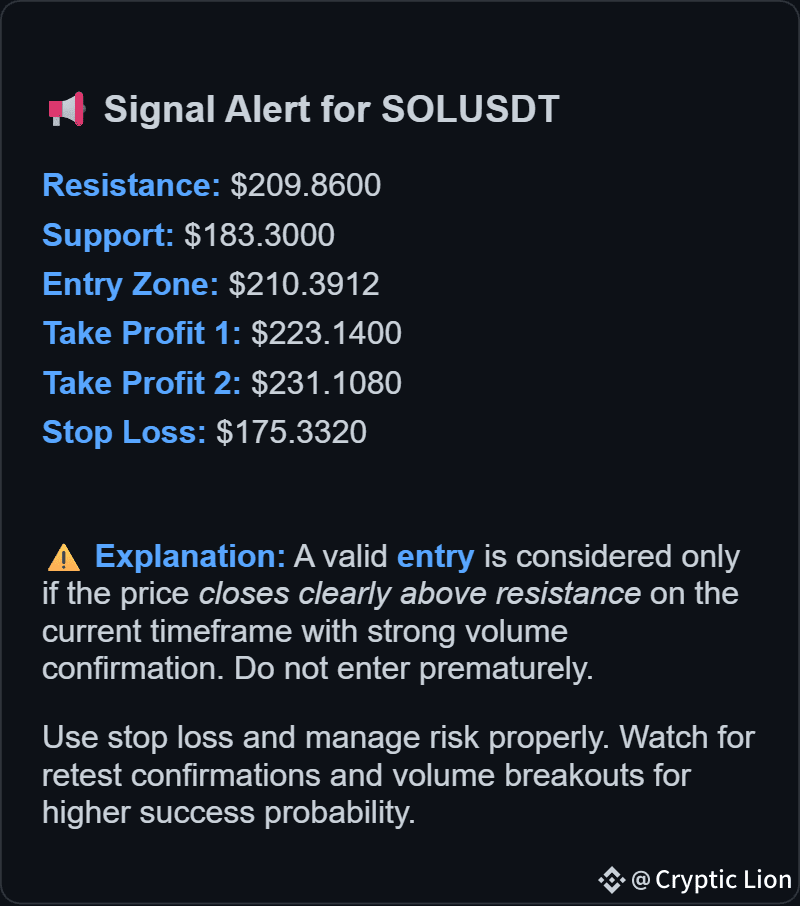
🔑 Signal Levels
Resistance: $209.86
Support: $183.30
Entry Zone: $210.39 (after confirmed breakout with volume)
Take Profit 1: $223.14
Take Profit 2: $231.10
Stop Loss: $175.33
⚠️ Trading Note: Entering before a confirmed breakout carries higher risk due to bearish short-term signals. Conservative traders should wait for a strong 4H close above $210 with rising volume.
✅ Conclusion: SOL remains one of the stronger alts, but the battle between short-term sellers and higher timeframe buyers is clear. A breakout above $210 unlocks the next wave toward $223–$231, while failure risks a retest of $183. Trade with confirmation and strict risk management.
Trade here $SOL