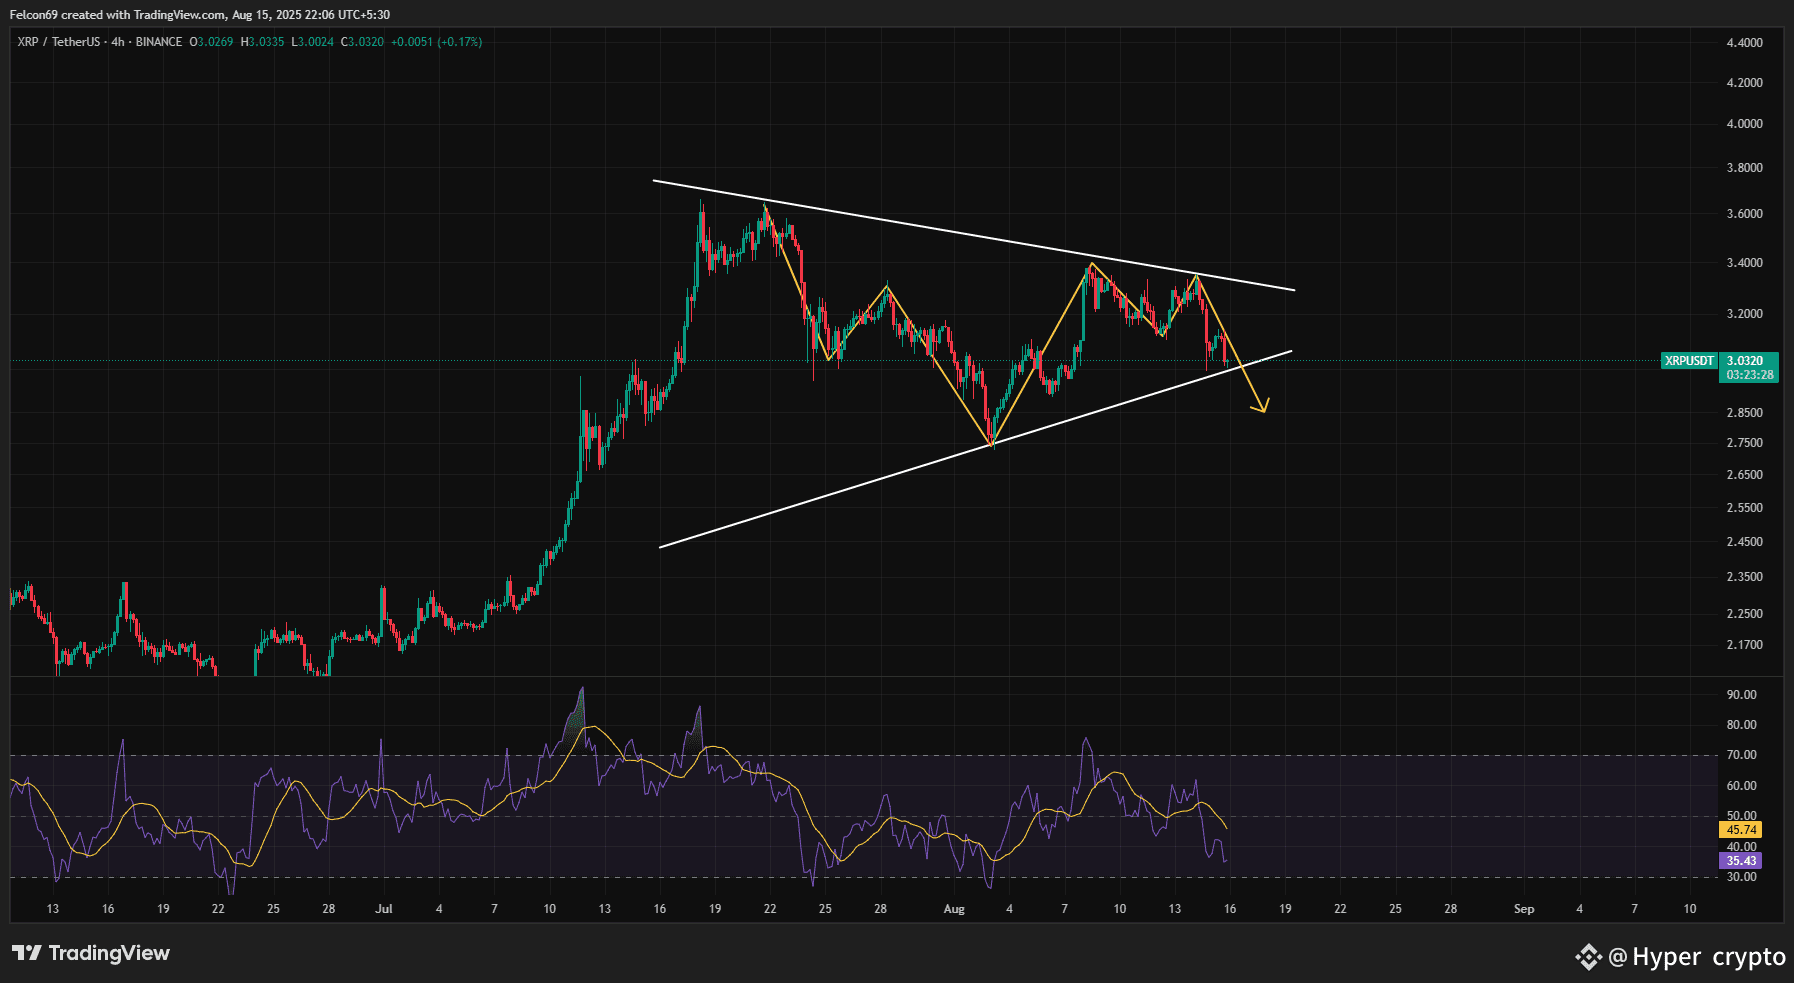
COIN NAME : $XRP
SIGNAL TYPE: SHORT
I can see on XRP price is trading within a symmetrical triangle pattern ⚠️. This pattern is formed by a series of lower highs and higher lows, indicating a period of consolidation and indecision in the market 😬. The price is currently moving toward the apex of the triangle, and a breakout is imminent 💥. The RSI is hovering around the 50 level, reinforcing the neutral sentiment. A breakdown below the lower trendline could signal a continuation of the previous downward move, with a potential target of $2.70 ⬇️. Conversely, a breakout above the upper trendline could signal a new bullish trend, with a target of $3.60 🚀. Traders are waiting for a clear breakout in either direction before making a move 👀.
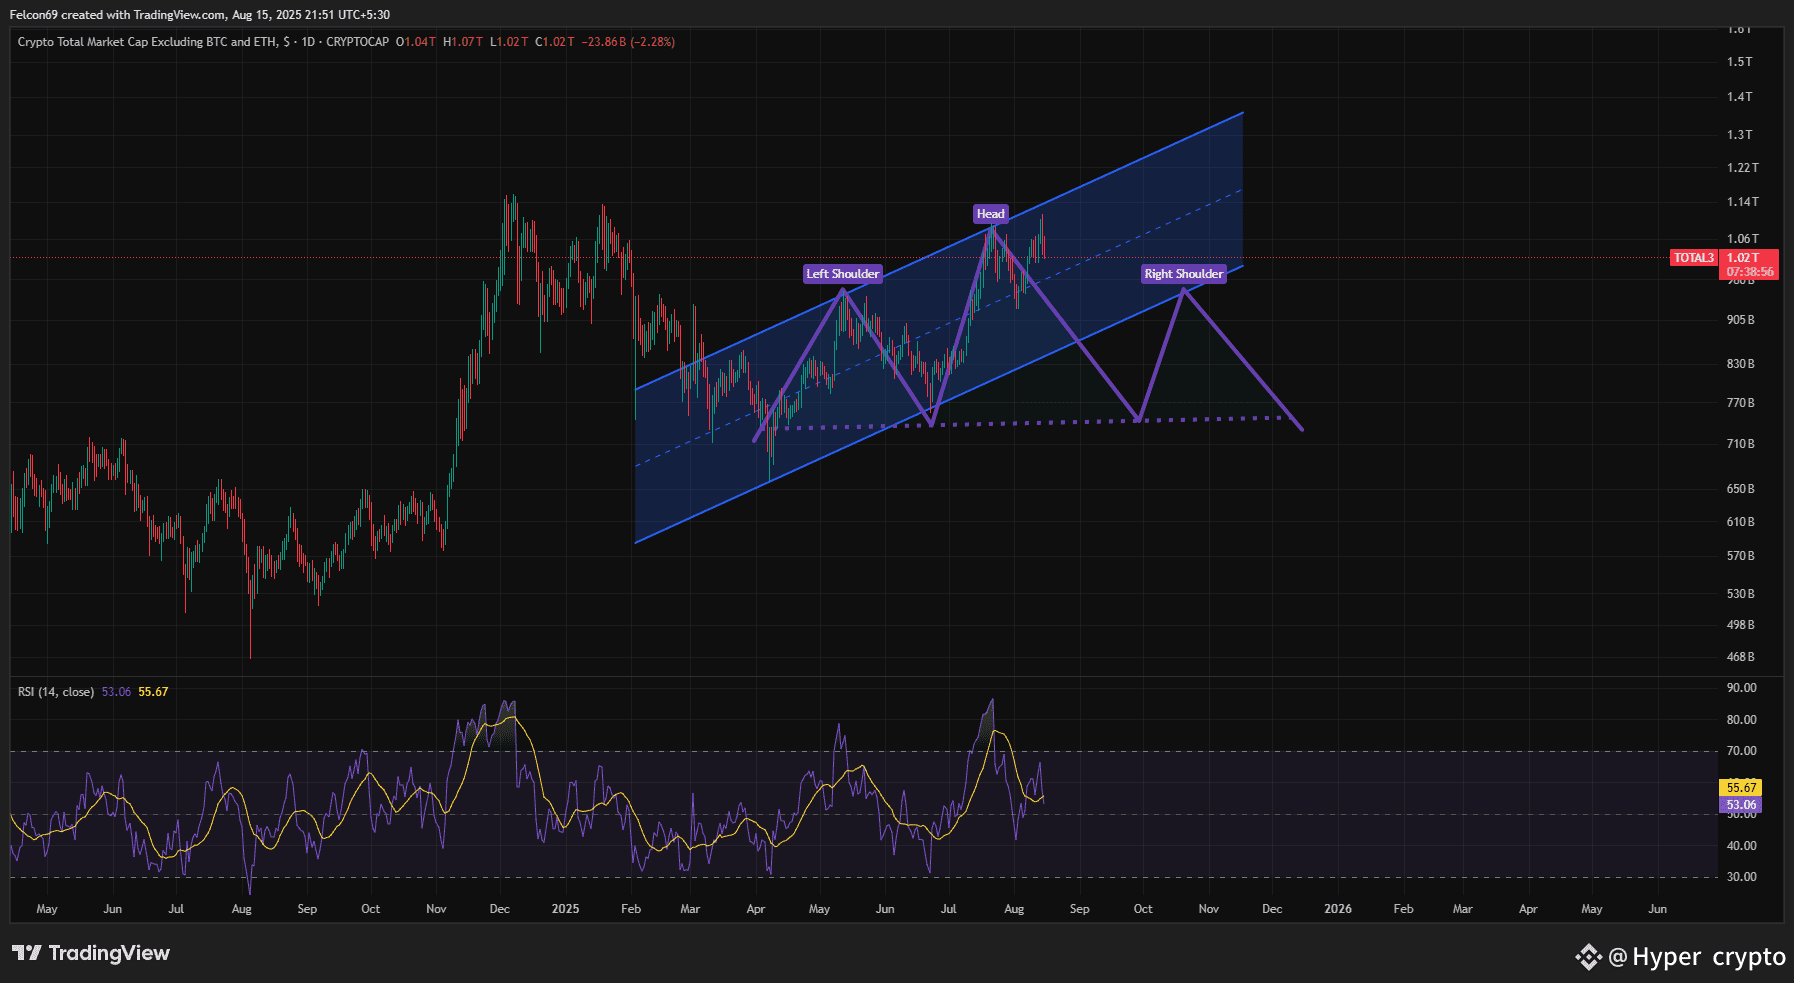
I can see (TOTAL3) is showing a potential head and shoulders pattern 🤯. This pattern is a bearish reversal signal 🚨. The chart shows a clear left shoulder, a higher head, and now the price is potentially forming the right shoulder 📉. The price is also trading within a rising channel, but the RSI is showing a bearish divergence 🐻, as it failed to make a new high along with the price. A break below the neckline of this pattern, which is the support level connecting the lows of the shoulders, would be a strong confirmation of a downward trend ⬇️. The target would be the height of the head from the neckline, suggesting a significant correction for altcoins 😬.
ENTRY PRICE : 3.0203
TP 1 :2.9606
TP 2 :2.8649
SL : 3.2141
For more details, click on my profile and check my BIO .
This signal is for spot trading only. If you're interested in future signals, join my Binance Live .
Simply click on my profile to join!
