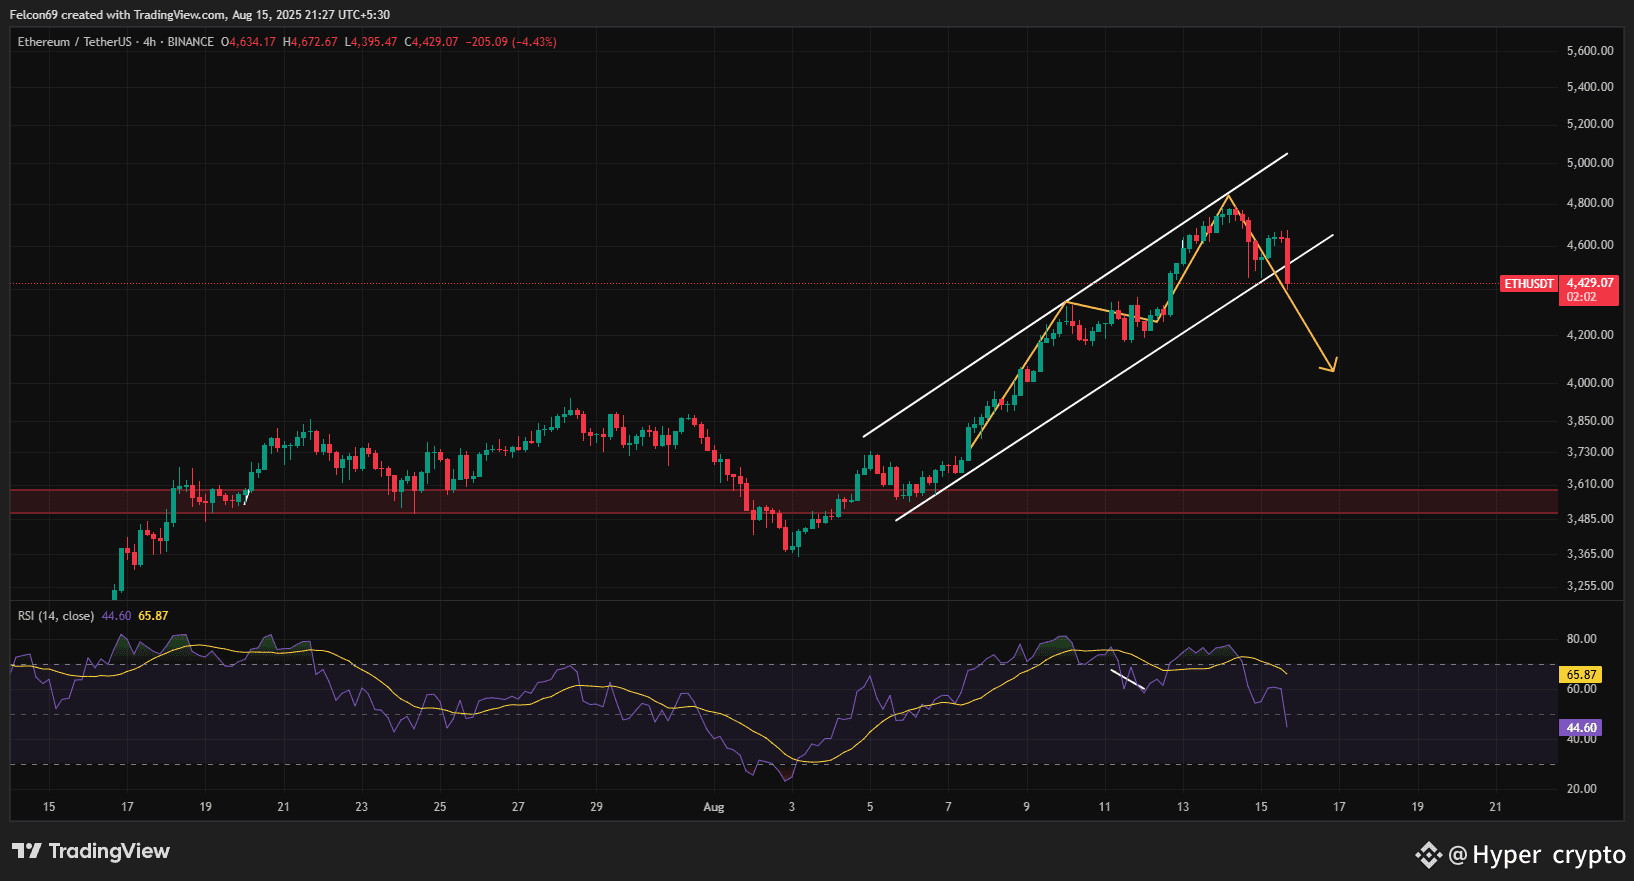
COIN NAME : $ETH
SIGNAL TYPEE : SHORT
I can seee Ethereum's price is showing a potential bearish divergence 📉. The price formed higher highs, as indicated by the upward channel 📈. However, the Relative Strength Index (RSI), which measures momentum, failed to confirm these new highs, instead forming lower highs 📉. This disconnect suggests that the upward momentum is weakening, despite the price continuing to climb 😬. The price has now broken below the lower trendline of the channel, a strong signal that the uptrend may be ending 🚨. A potential price target could be the previous support zone around $3,500-$3,600 📉, as indicated by the projected yellow line ⬇️. Traders often interpret this as a signal to be cautious or to consider short positions 😬.
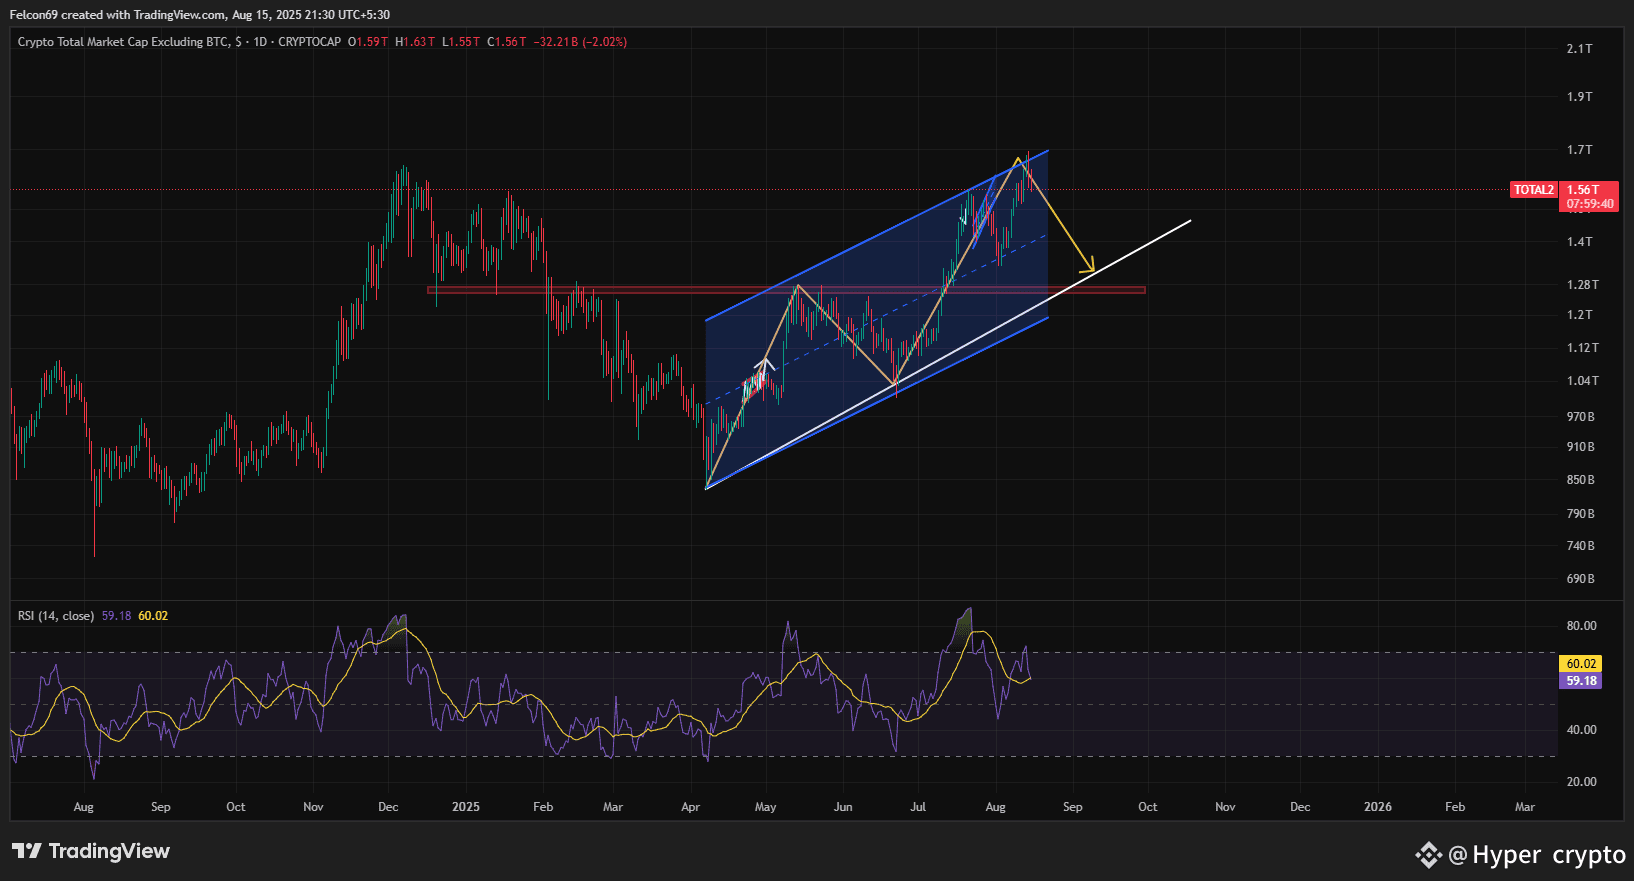
I can see on (TOTAL2) is showing a potential bearish divergence 📉. The price formed higher highs within a clear rising channel 📈, but the RSI (Relative Strength Index), which measures momentum, failed to reach new highs, forming a lower high instead 📉. This indicates that the buying pressure is weakening despite the price's continued rise 😬. Currently, the price has broken out of the channel, a sign that the uptrend may be over 🚨. The chart projects a potential move down to the strong support zone around $1.2 trillion ⬇️, where the previous resistance line and the lower trendline of the channel meet. This suggests a period of correction or consolidation might be ahead 🤔.
ENTRY PRICE : 4413.82
TP 1 : 4351.58
TP 2 : 4211.02
SL :
For more details, click on my profile and check my BIO .
This signal is for spot trading only. If you're interested in future signals, join my Binance Live .
Simply click on my profile to join! #hypercrypto18
