Coin: $ETH | Type: SHORT (Spot)
📊 What I’m Seeing on the Chart:
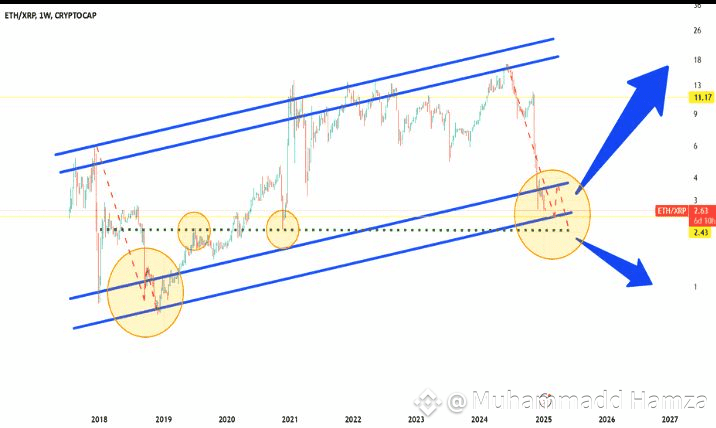
Ethereum just flashed a textbook bearish divergence — and it’s not looking pretty 😬.
Price has been grinding higher 📈, forming higher highs inside an upward channel.
But the RSI (momentum indicator) is telling a different story — it’s making lower highs 📉.
This mismatch is a big red flag 🚩 that buying pressure is fading even as the price climbs.
🔥 Confirmation Just Dropped:
The price has broken below the channel’s lower trendline 🚨 — a strong sign that the uptrend could be done. My eyes are now on the $3,500–$3,600 zone ⬇️ as the next potential target.
📌 TOTAL2 Chart is Saying the Same Thing!
Total Altcoin Market Cap also showing bearish divergence 📉.
Rising channel broken — target around $1.2T 🏦 where major support sits.
This could mean a broader altcoin correction phase is kicking in! 😱
💰 Trade Setup (Spot Only):
Entry: 4413.82
TP1: 4351.58
TP2: 4211.02
SL: Manage according to your risk ⚠️
⚠️ Why This Matters:
This isn’t just an ETH thing — if TOTAL2 is right, the whole alt market could be in for a pullback. Patience & discipline will save your bags! 🛡️
📢 Your Move:
➡️ If you trade spot, watch these levels closely.
➡️ For future signals & live setups, hit my profile and check my BIO. 🚀
#Ethereum #CryptoSignal #ETH #BearishDivergence #BinanceLive