Daily sharing
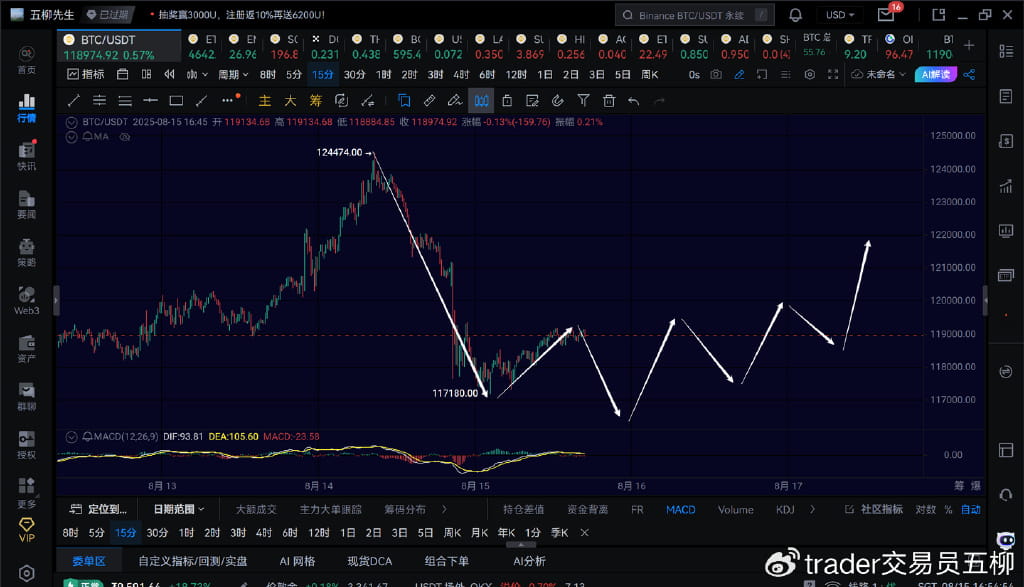
Last night, Bitcoin failed to hold the 120000 mark, dipping as low as around 117180 after a sharp drop. It is clear that Bitcoin has ended the 4-hour upward movement that started from 111920, and we currently believe that a new downward movement at the 4-hour level has begun, with the focus below being around 110000-111000. If it breaks below 110,000, we will consider it to be a downward correction at the daily level, or if it doesn't break and a second sell signal appears at the 4-hour level, it can also confirm the downward movement at the daily level.
Yesterday morning, the internal group had already indicated that Bitcoin should take profits, but I didn’t dare to short directly. The article updated around seven or eight o'clock last night also warned about risks, mentioning that Ethereum had a downward spike, but it was not the kind of spike mentioned in last night's article.
So the 4-hour level correction of Bitcoin, does that mean Ethereum is also in a 4-hour level correction? It is very likely that Ethereum is still in a wave of upward movement at the 4-hour level, and after a short-term correction, it may rise again to a new high, and then simultaneously undergo a downward movement at the 4-hour level.
Important notice: Starting from August 16, 2025, our analysis articles will no longer provide short-term points. The articles will only give short-term trend structures and directions, while long-term points will still be provided in the articles. If you want to know our article's short-term points and real-time analysis, please message me to join the internal member group.
Today is the last day for me to provide short-term points in the article. I hope everyone will support the article with a like.
BTC medium to long term
Weekly:
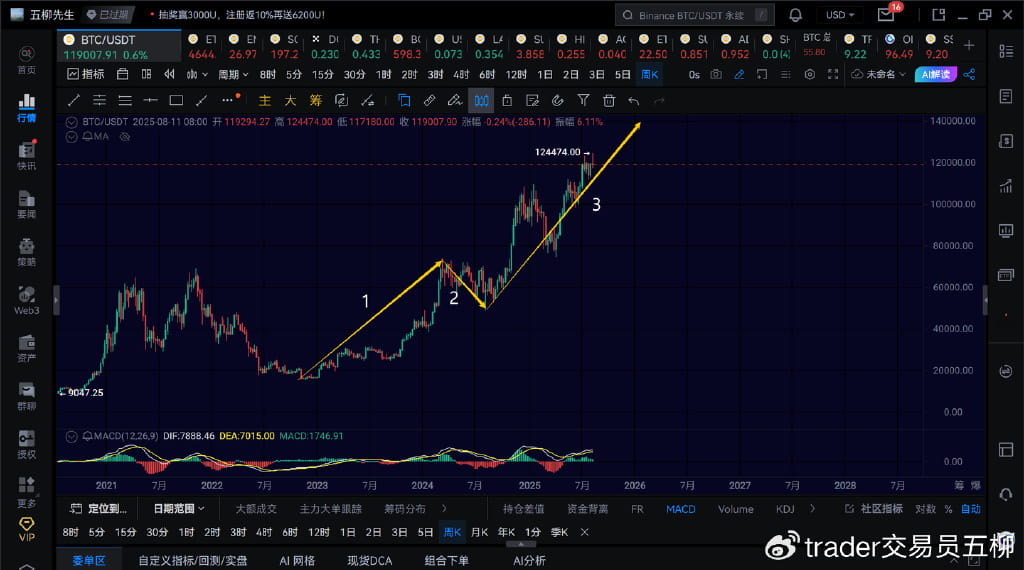
On the weekly level, we are still bullish; we are currently running the third upward movement at the weekly level, aiming for the range of 150,000-200,000, with an expectation to see around 180,000. The timeline corresponding to this target focuses on the end of January 2026.
Daily:
Daily level:
49000-109588 is the first upward movement at the daily level;
109588-74508 is the second downward movement at the daily level;
74508-124474 is the third upward movement at the daily level;
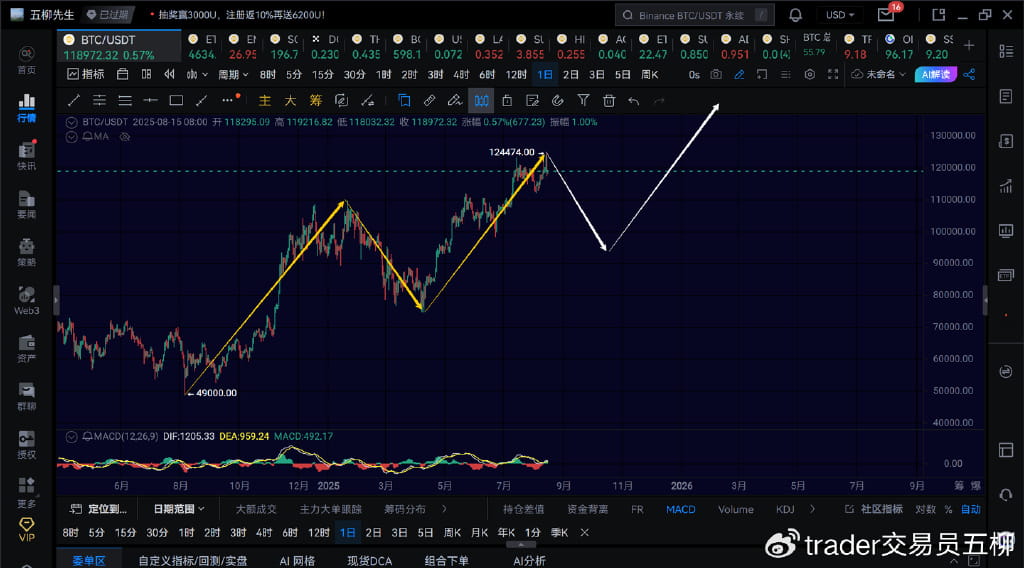
Currently, there is a possibility that the third upward movement at the daily level may end. 124474 has a chance of becoming the peak of the third upward daily movement, but it has not been confirmed yet. If Bitcoin breaks below 110,000 by the end of this month, or if a second sell signal appears at the 4-hour level in September, we will consider that Bitcoin has begun a downward movement at the daily level.
If Bitcoin is to undergo a downward movement at the daily level, then the focus below should be on the range of 90000-98000. It is expected that by October, Bitcoin will begin its fifth upward movement at the daily level, aiming to reach the range of 150,000-200,000.
4H:
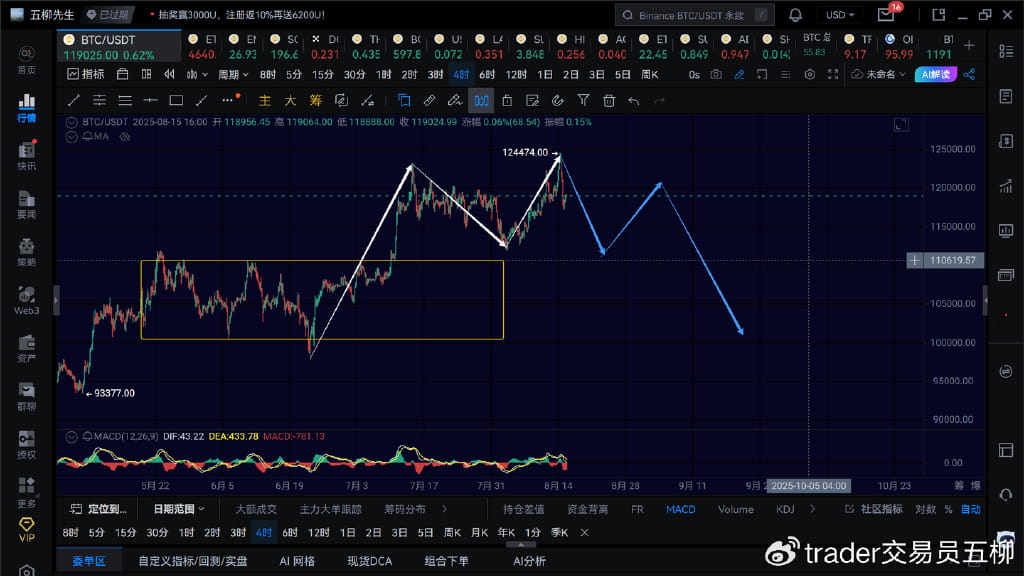
At the 4-hour level, this should normally be running a downward movement at the 4-hour level. The focus below is around 110,500. After the 4-hour level correction is completed, there will be another upward movement at the 4-hour level, expected to rise again to around 122,500. If it can't break 124,400, then it will proceed to a third downward movement at the 4-hour level, reaching around 100,000.
BTC short-term
Due to the rapid changes in the market, the article can only make predictions based on the market conditions at the moment of publication. Short-term players should pay attention to the latest changes in the market, which only serve as a reference.
1H:
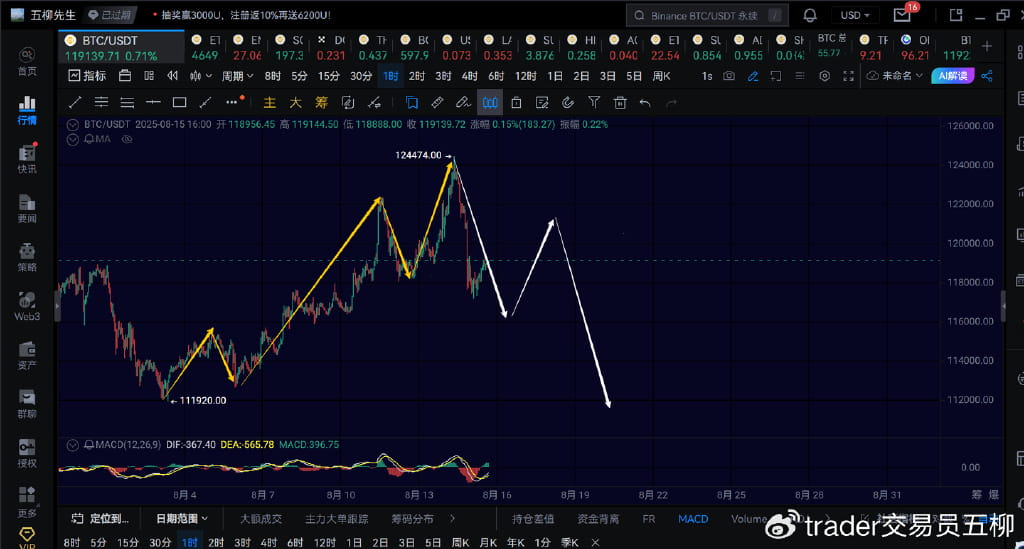
At the 1-hour level, Bitcoin is still undergoing a downward movement at the 1-hour level, and it is expected that it will normally retest around 117000 again, or in the range of 116000-117000. It is expected that from the weekend to next Monday, there may be a second upward rebound at the 1-hour level, focusing on 121200 above. As long as it can't break above 123000, it will continue to a third downward movement at the 1-hour level.
15M:
At the 15-minute level, during the day there was a 15-minute level rebound, which normally should still see a 15-minute level decline retesting 117000 or in the range of 117000-116000. After that, there may be a 1-hour level rebound, and it is possible that from Saturday to Sunday there will first be a consolidation of a 15-minute level central point, and then push up above 120,000.
ETH
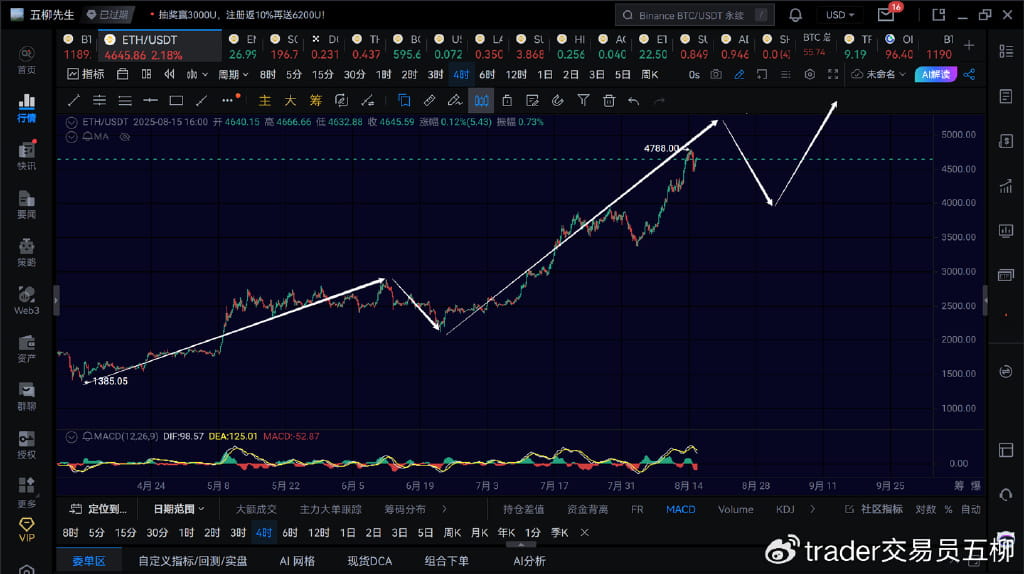
At the 4-hour level for Ethereum, it should currently be running the third upward movement at the 4-hour level within the upward movement at the daily level, aiming for around 5000 above. The latter half of next week may see the fourth downward movement at the 4-hour level, focusing on around 4000. Expected by the end of August, there may be a fifth upward movement at the 4-hour level, targeting above 6500.
In mid-September, Ethereum may undergo a downward correction at the daily level, going down to around 3000. Then in November, Ethereum will undergo the next upward movement at the daily level, with an expectation to break 10,000 by February 2026.
The above is purely speculative; in reality, we cannot predict Ethereum too far in advance and should take one step at a time.
Previously, some friends asked me why institutions in the U.S. did not buy ETH in large quantities when the price was over 1000 or 2000, but instead started buying heavily when it rose to over 3000. Did institutions not recognize the value when the price was low?
Institutions, like us, cannot see too far ahead when the price is very low. When the price rises, along with some fundamentals and favorable factors appearing, institutions realize that this asset should still rise high, so they entered the market at relatively high prices above 3000, instead of entering at 1400. Isn't this just taking one step at a time? When they reached a certain stage, they realized the upward trend was natural, so they began to buy ETH in large quantities.
As for myself, when Ethereum fell to 1385, I couldn't see 4000, 5000, or even higher all at once. When it was at 1500, I was actually bullish up to the range of 2800-3000. However, when in May, Ethereum rose to over 2800, I realized that the upward structure at the daily level had not completed, so during the process of Ethereum correcting from 2800 to 2111, I firmly held a bullish view towards around 3400, without considering that Ethereum would go straight to 4000.
Then when Ethereum rose to 3400, I found that the upward momentum was unstoppable. At that time, I thought Ethereum might touch around 4000 before ending the upward movement at the daily level. As a result, during the process of Ethereum correcting from over 3900 to 3354, I noticed a large number of institutions were buying frantically, continuing to buy even as the price fell. Coupled with the technical structure of the trend, I inferred that Ethereum would break through 4100 and go above 5000, possibly reaching 10,000 by the end of the year.
You see, all these ideas are actually about taking one step at a time; we can't predict prices too far in advance when the price is very low. If I could know in advance that Ethereum would rise to 4800 in August, I might really sell my house and go all in, but I cannot know that in advance. What I can predict is where the price might go in the short to medium term.
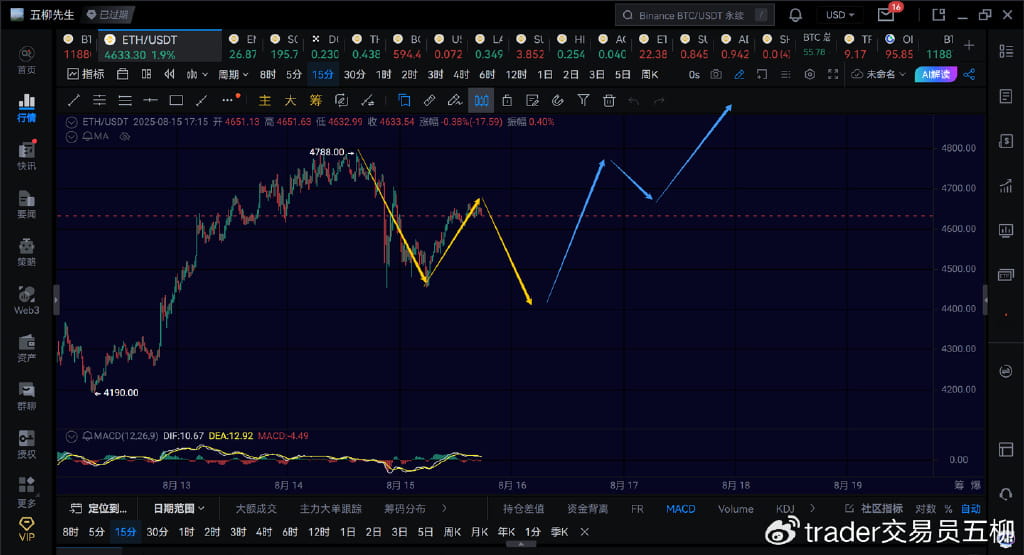
Ethereum's short-term correction here is only a 1-hour level correction, not a 4-hour level decline. Therefore, after completing the downward movement at the 1-hour level, it is highly likely that there will be another upward movement at the 1-hour level to challenge above 5000.
At the 15-minute level, there should still be a 15-minute level correction to retest around 4400, and after that, start the next upward movement at the 1-hour level.
Trend direction
Weekly level: Direction upwards, currently undergoing a new upward movement at the weekly level, with an overall target above 150,000.
Daily level: Direction downwards, the upward movement at the daily level may continue to end, observing whether there is a secondary high point in the subsequent 4-hour level.
4-hour level: Direction downwards, looking at a downward movement at the 4-hour level in the short term.
1-hour level: Direction downwards, the current 1-hour downward movement should still be able to go down further.
15-minute level: Direction downwards, watching whether the 15-minute level correction retests around 117000 or lower.

