On the journey of investing in digital currencies, I have gradually fought from an initial capital of only 5000 yuan to eventually transform into a middle-class individual with a net worth of 35 million.
Today, I am willing to selflessly share the valuable experiences from this journey with every like-minded friend.
Navigating the ocean of digital currencies, the art of capital management is crucial. I tend to divide my capital into five equal parts, using only one part for trading at a time, so even when encountering storms, I can maintain the stability of the vessel. I set a rule for myself: once losses reach 10%, I immediately retreat, regardless of how turbulent the external conditions are. Even if I face small setbacks five times in a row, my losses will be limited to half of my capital. Once I catch a wave of profit, the returns will far exceed this. Even if occasionally trapped momentarily by the market, I can remain calm and composed.
Following the trend of the market is the most reliable beacon to success. During a market downturn, never blindly catch the bottom; that is merely an illusion like a mirage. It is only when the market warms up and retraces that we find golden opportunities to buy low, which is much safer than blindly holding the bottom.
I firmly believe that trading charts must remain simple and reasonable, making trading decisions based on the raw price movement data. In this way, traders can avoid unnecessary indicator interference. I do not need any indicators or EAs to make trading decisions; I always focus on the study of initial price movements of currency pairs, commodities, etc. I believe price action is one of the closest, most reliable, and profitable ways to trade.
I have been doing this for 10 years, and I will continue to do so in the future. Price action is the way to go!
The candlestick patterns in price action breakout strategies that I focus on are two types of candlestick breakout trading setups:
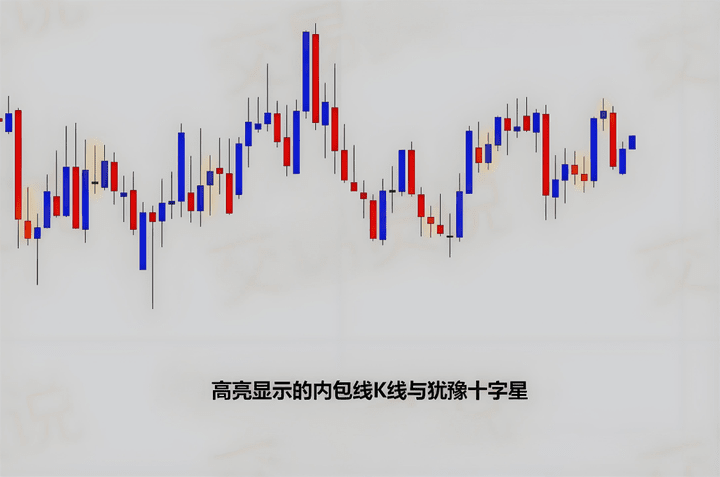
◎ Inside Bar Breakout
◎ Hesitant Doji Breakout
These two patterns are more like catalysts rather than direct price action signals.
We hope they appear at important price levels (identified through price action analysis) and then prepare for the expected breakout trend.
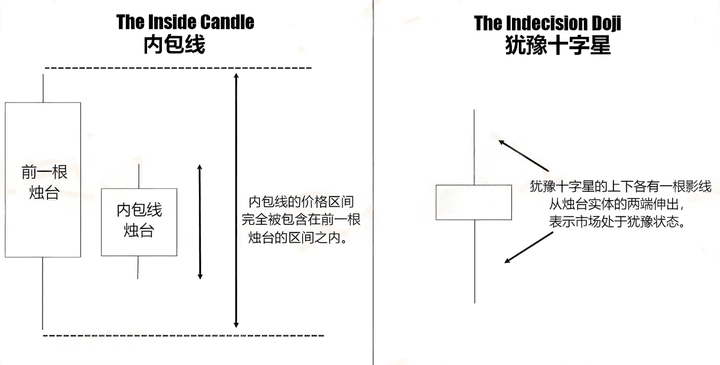
An inside bar refers to a candlestick whose range is completely contained within the range of the previous candlestick, meaning both its high and low are within the range of the previous candlestick.
Related articles: (Inside Bar 5 Great Killers: Price Action 'Perspective' Secrets Not Shared by Professional Traders, Violently Crack the Trend Continuation Code!), (How to Trade Inside Bars? Here’s a Practical Guide)
The doji pattern refers to this candlestick, which is easily identifiable due to its nearly symmetrical structure with upper and lower shadows. The shadows extend from both ends of the candlestick body, conveying that the market was in a state of indecision during its formation.
Related articles: (A special and important candlestick pattern: Complete analysis of the doji trading strategy), (A trading strategy that can profit hundreds of points in one go - 'Double Doji' trading system), ('Gravestone Doji' chart pattern, can it become a guiding star in trading?)
We can trade such price breakouts after hesitation in the right market background.
Pro Tip: If you rashly trade every inside bar and doji pattern, you will be ruthlessly harvested by the market!
When looking for candlestick breakouts, it is essential to ensure they align with your chart analysis to improve your odds.
Below is an example of an inside bar formed in an uptrend environment:
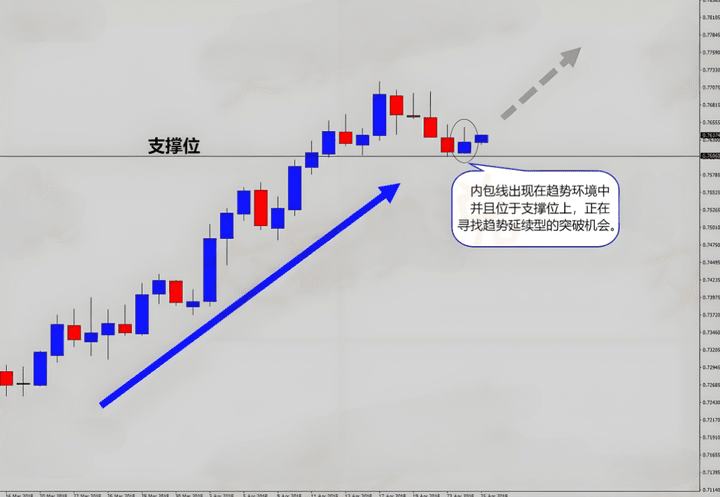
We are waiting for the price to break through the high of the inside bar to trigger the breakout signal, confirming that the trend continues upward, and then we will enter the market.
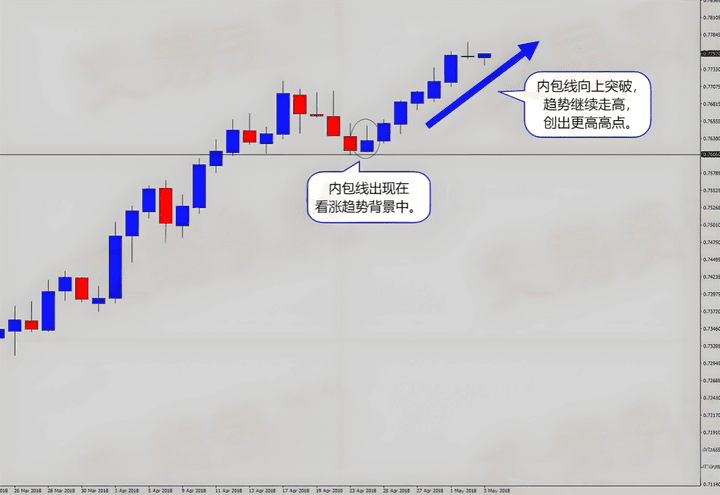
As expected, the price broke through the high of the inside bar, and the trend continued to push forward.
Note that this inside bar also happens to fall at a support level in the trend— the more 'value' you can build for the breakout trade, the higher the quality of the trade.
Market background is extremely important when trading breakout patterns!
If there is no clear market background, do not rashly attempt such breakout trades... For example:
As shown in the figure, this is a market state with no background to rely on—ranging or 'neutral' market. At this time, attempting to trade breakouts is just blindly trading in the middle of a dense trading range, which is meaningless.
All the inside bars and hesitant doji patterns in the chart appear under very dangerous conditions. Trading breakouts without momentum carries extremely high risks!
Always remember, chart analysis always takes precedence over the signals themselves.
Trading hesitant breakouts like dojis also follows this principle. Please find the position on the chart where you expect the market to reverse, then look for signals and trade the breakout in the reversal direction.
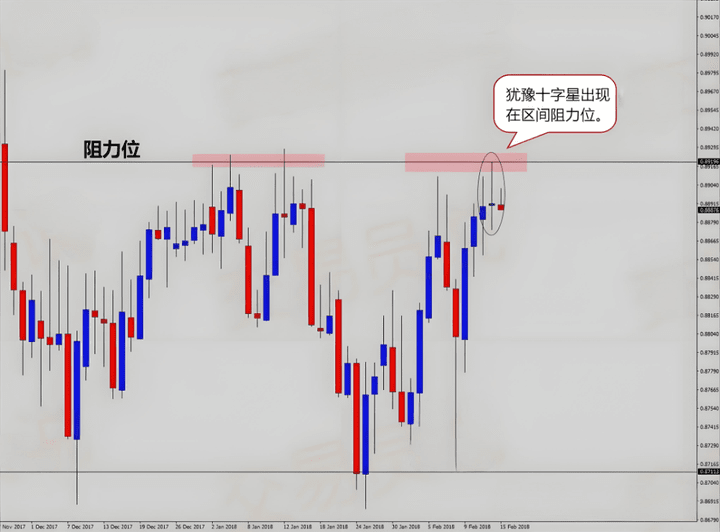
In the above figure, we see a doji pattern appearing at a very ideal position on a technical level—at the resistance level at the top of the range.
If the market is about to reverse, we hope to seize the opportunity for a downward breakout from this 'hesitation.'
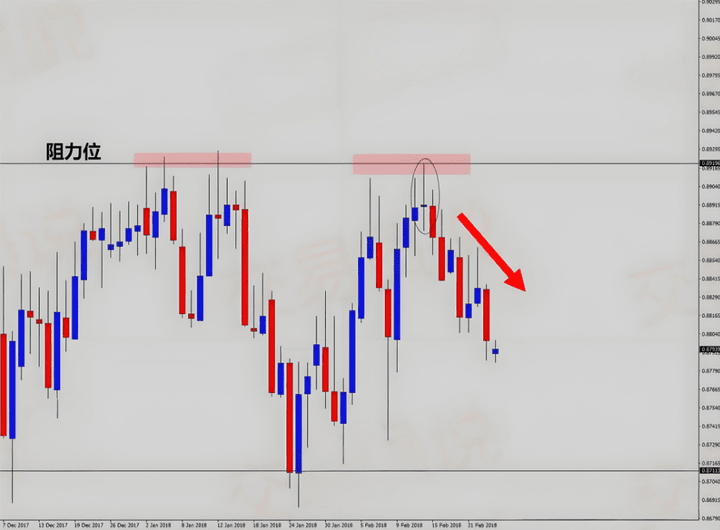
Boom... the market broke through the low of the doji pattern and subsequently fell for two consecutive weeks.
Engulfing candlestick pattern: 'Overwhelming price trend'
The third type of candlestick pattern is the 'engulfing pattern,' which indicates a strong overwhelming fluctuation in the market.
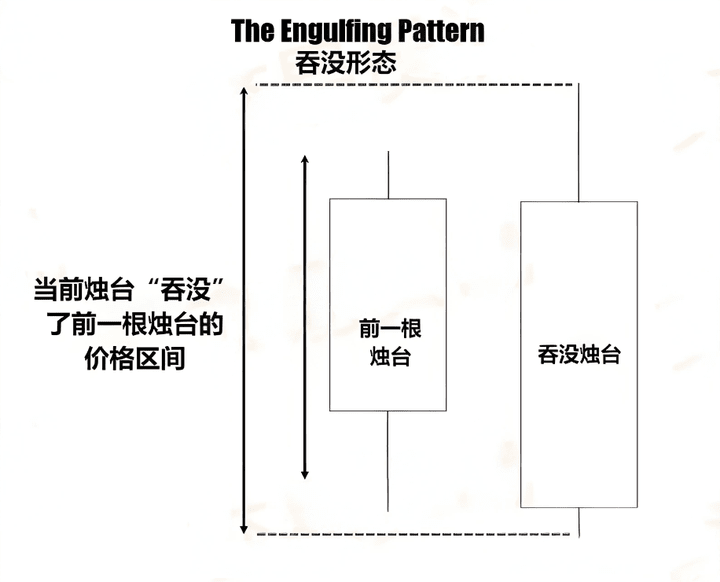
This pattern usually appears when the market experiences strong, sudden fluctuations. The term 'engulfing' comes from: a sudden price movement completely engulfs the fluctuation range of the previous candlestick.
What we need to do is try to capture the continuation of the trend after this engulfing action.
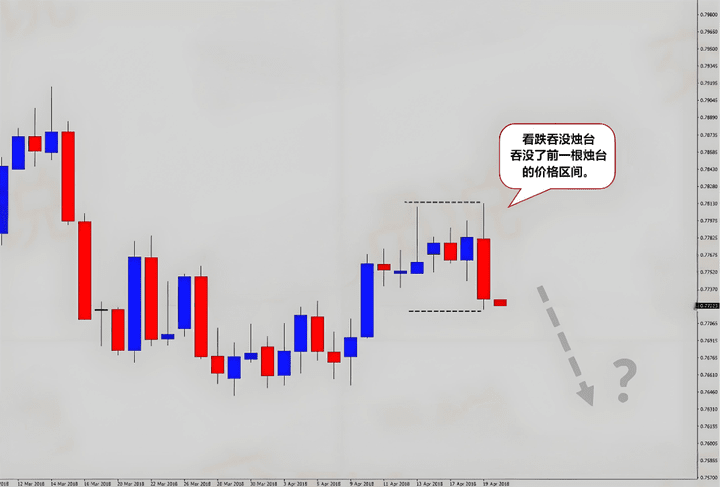
The image above shows a very strong engulfing candlestick, which even engulfs the ranges of several previous candlesticks.
This is due to a decisive and strong downward movement in the market, so we expect further declines in the future...
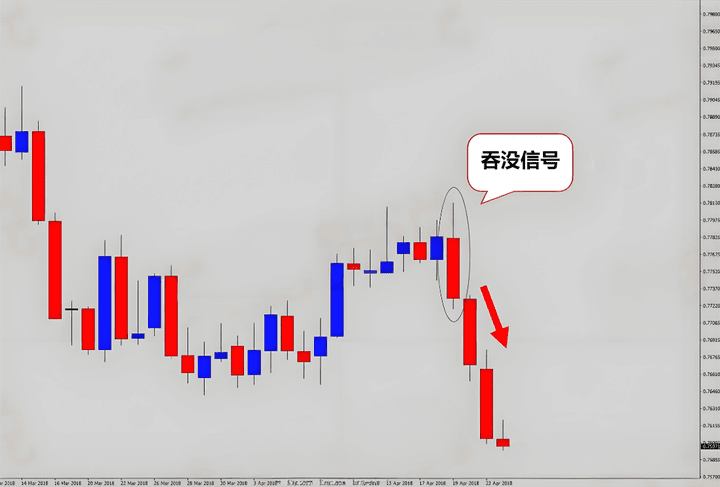
As expected, the market continued to fall, and it was a very strong downward movement.
This is exactly the core principle behind the engulfing signal; we wish to capture this continuity of fluctuation triggered by the initial strength or weakness.
Below is an example of a bullish engulfing pattern that appears at a support level:
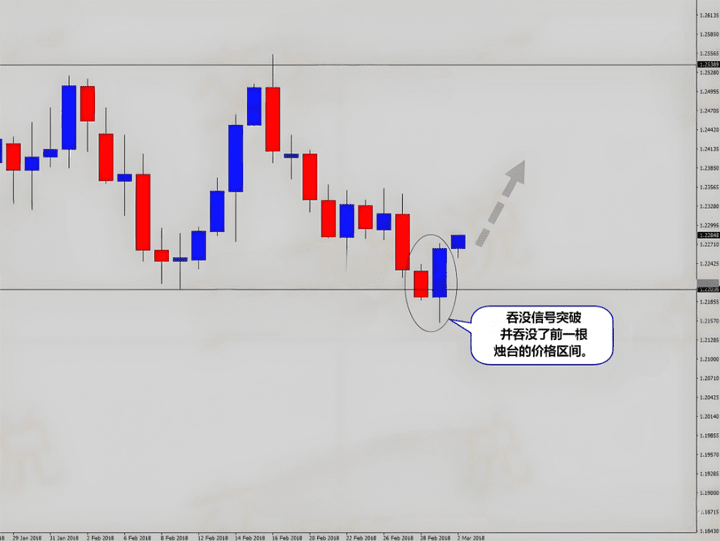
Here we have ample reason to expect the market to experience a wave of upward movement. The market is strongly rebounding from a range support position, thereby forming a bullish engulfing pattern.
Most traders seeing this may decisively go long, but what happened next...
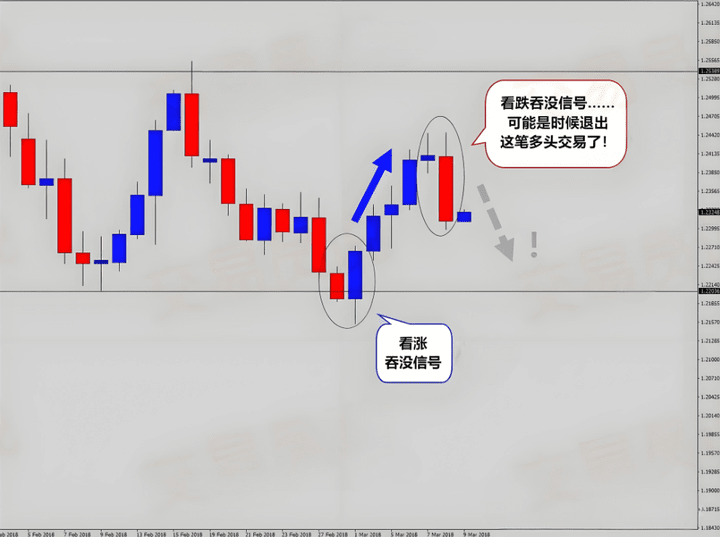
The market indeed continued this wave of rebound, but wait—there was a plot twist!
During the advance of the bullish trend, a candlestick of the opposite direction, 'bearish engulfing,' appeared. Now we expect the market to continue falling, as this indicates a clear bearish trend.
At this point, viewing it as an 'early exit signal' from the original bullish trade is wise, as the price is likely to continue falling, undermining your initial bullish trading plan.#山寨币谷歌热度创五年新高
This situation does indeed happen.
Sometimes the market suddenly gives a very clear opposite direction candlestick signal. This type of signal can serve as a warning to retreat. However, you must confirm that it is a clear and valid signal; do not be frightened off by insignificant small candles!
As I mentioned earlier, candlestick patterns are always an important component of an excellent price action strategy—however, other factors must also be considered before treating them as valid trading signals.#以太坊市值超越Netflix
Does this candlestick signal align with your technical analysis background?
Is it in a reasonable position within the trend structure?
Please remember that buy/sell signals from candlestick charts must be considered in conjunction with the entire technical analysis, rather than relying on them alone.
Summary
The key to trading breakout patterns is ensuring you have sufficient market background, and that the breakout direction aligns with your technical analysis. Do not rashly attempt breakout trades in difficult-to-interpret market conditions, as this can easily lead to significant losses!
Additionally, the engulfing candlestick is formed by strong and sudden fluctuations in the market. This rapid action 'engulfs' the fluctuation range of the previous candlestick, hence the name. The market usually continues in the original direction after bullish or bearish engulfing patterns.#BTC再创新高
But still remember, their effectiveness is best only when consistent with the background of price action analysis.
Finally, let me share a set of iron rules:
1. In most cases, Bitcoin is the leader of price movements in the crypto circle. Ethereum, being a strong coin, sometimes breaks away from Bitcoin's influence to create a unilateral market, while altcoins generally cannot escape its influence.
2. Bitcoin and USDT move inversely; if USDT rises, be cautious of Bitcoin falling; when Bitcoin rises, it is a suitable time to buy USDT.
3. Between 12 AM and 1 AM, pinning phenomena are likely to occur, so domestic traders can try to set a low buy price for their desired coins just before sleeping and a high sell price. You might just get a deal while lying down.
4. Every day from 6-8 AM is a time to judge whether to buy or sell, and also a time to assess the day's rise or fall. If the period from 12 AM to 6 AM has been falling, and it continues to fall during this time, it is a good time to buy or add positions; the day is likely to rise. If the period from 12 AM to 6 AM has been rising, and it continues to rise during this time, it is a selling opportunity; the day will most likely fall.
5. 5 PM is an important time point for rumors in the market; due to time zone differences, American traders are waking up to work, which may cause fluctuations in the price of coins. Significant rises or falls have indeed occurred at this time, so be particularly vigilant.
6. There is a saying of 'Black Friday' in the crypto circle, and there have been a few instances of significant drops on Fridays, but also cases of large rises or sideways movements, so it's not particularly reliable; just pay a little attention to the news.
7. If a coin with a certain trading volume guarantee falls, don't worry. Patience will certainly lead to breakeven; in short, within 3 or 4 days, or up to a month. If you have spare USDT, you can add positions in batches to bring the price down, and breakeven will happen faster. If you don't have spare cash, just wait. It won't let you down unless you really bought an 'I' coin.
8. Holding the same coin for the long term in spot trading yields greater returns than frequent trading, depending on whether you have the patience to hold. I bought Dogecoin at 0.089, and it has multiplied over 20 times since then.
These are my opinions and insights; if you find them helpful, please like and save them. I am Yan An, someone who has experienced three cycles of bull and bear markets, skilled in logical coin selection and timing. I only trade within my understanding, and every direction has been confirmed by the market!
Even the most diligent fisherman wouldn't go out to sea to fish in stormy weather; instead, they would carefully protect their boat. This storm will pass, and a sunny day will surely come! Follow Yan An, and I will teach you both fishing and how to fish. The door to the crypto world is always open; only by following the trend can you have a life of following the trend. Save this in your heart!
