Treating cryptocurrency trading as a serious job, going to work on time every day—that's the survival strategy I've summed up after years of trials and tribulations.
In my early years in the field, I, like many others, stayed up late staring at the market, chasing highs and cutting losses, losing sleep over it. Later, I stubbornly adhered to a simple method, and surprisingly, I managed to get through it while slowly achieving stable profits.
Many people, when investing, always think about defeating and surpassing others in the complex market. However, I believe that investing is more about self-cultivation rather than simple competition with others. Successful investing is more about introspection, focusing on oneself, and achieving oneself. Only by cultivating a good inner self, honing excellent personal qualities, and gaining insight into complex human nature can our investments get closer to the door of success.
Having a strong interest and passion for investing for ten or twenty years is very challenging. You all know that a prince in the Middle East named Alwaleed was interviewed by a reporter from the Associated Press, who asked him, 'Have you made mistakes in your investments throughout your life?' He replied that he had never made a mistake. You might find this surprising. When I saw this interview, I found it strange; he said he had never made a mistake, but he had made many errors worth billions of dollars. If an investment manager rarely makes mistakes, or even never makes mistakes, it is actually very dangerous.
Investing is something that is covered in books; you technically don’t need to listen, but you must practice. It's like telling children to be strong-willed and diligent throughout their lives. Whether they can do this is very difficult. When we look for employees or partners, in addition to intelligence, it is very challenging to find someone who has had a strong passion for one thing for ten or twenty years.
So how can we do well in cryptocurrency trading? Once a person enters the financial market, it is hard to turn back. If you are currently losing but still confused, and you plan to treat cryptocurrency trading as a second career, you must understand the 'simplest MACD strategy.' Understanding it can help you avoid many detours. These are personal experiences and insights; I recommend saving and repeatedly contemplating them!
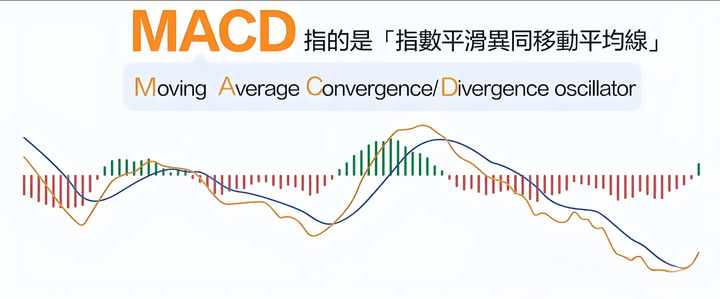
The MACD indicator (Moving Average Convergence/Divergence), known in Chinese as the 'Exponential Smoothing Difference Moving Average Line', is referred to by many as the 'King of Technical Indicators'. It is often preset to display the MACD indicator below the main chart in many software applications, indicating its popularity.
All equally applicable.
The MACD indicator has three parameters, with preset parameters set to 12 days, 26 days, and 9 days.
This article covers the following key points to help everyone understand the principles and usage of the MACD indicator.
Principle of the MACD Indicator: What is the MACD Indicator?
The MACD indicator (English: Moving Average Convergence/Divergence), known in Chinese as the Exponential Smoothing Difference Moving Average Indicator, is a classic indicator for predicting trends.
The MACD indicator was proposed by American Gerald Appel in the 1970s and is a long-established and widely used technical analysis tool.
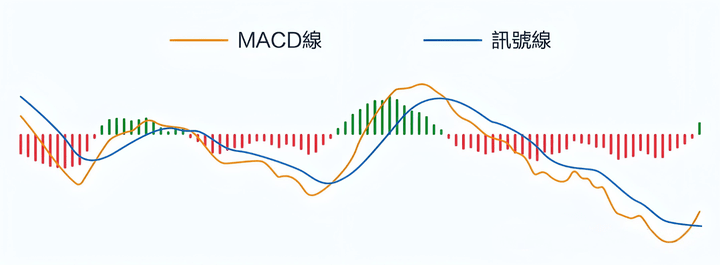
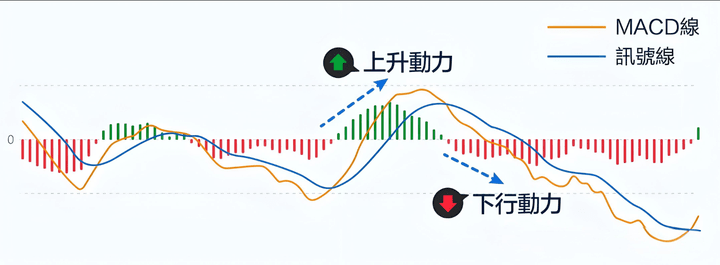
The MACD indicator consists of three key parts: the MACD line, the signal line, and the histogram. By analyzing the crossing and divergence of the two MACD indicator lines, we can intuitively understand price trends and strength changes.
Principle of the MACD Indicator: How to calculate the MACD indicator?
The MACD indicator includes DIF, DEA, and the MACD histogram, three parts, with the following calculation formula:
MACD Line (DIF, Fast Line) = 12-day Exponential Moving Average (EMA) - 26-day Exponential Moving Average (EMA)
Signal Line (DEA, Slow Line) = 9-day Exponential Moving Average (EMA) of the MACD Line
Histogram (MACD Histogram) = MACD Line - Signal Line
Note that in some trading software, the MACD line is also referred to as the DIF line, and the signal line is called the DEA line.
You only need to have a rough understanding of the MACD indicator's calculation formula and its underlying principles. Many stock software will automatically calculate and display it for us. What we need to do is analyze the MACD indicator.
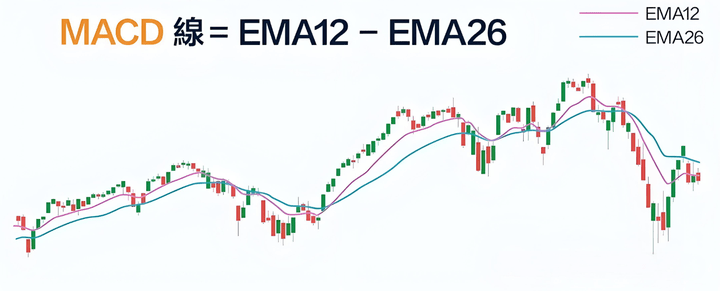
The principle of the MACD indicator is to subtract a longer-period average price (long-term EMA) from a shorter-period average price (short-term EMA), yielding the difference, which is the MACD line (DIF line), reflecting potential upward or downward trends in the market.
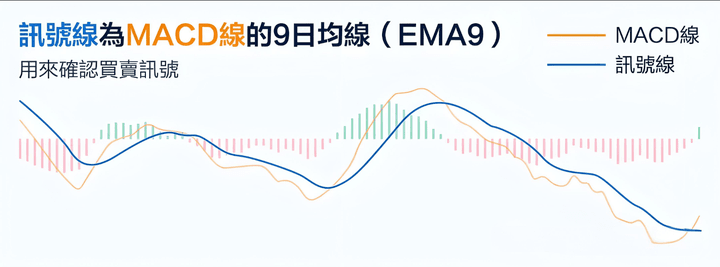
Based on this, a further buy/sell signal is generated through a signal line. The signal line is the exponential average of the MACD line and reacts relatively slowly to stock price movements, making it a lagging indicator compared to the MACD line, hence it is also called the 'slow line', while the MACD line is the 'fast line'. The intersection or divergence of these two lines can clearly release potential buy/sell signals.
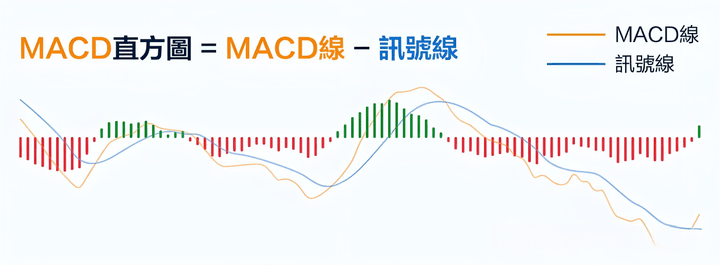
The histogram is even simpler; its value equals the fast line minus the slow line, distinguished by positive and negative values in red and green. If the histogram is positive (green) and continuously expanding, it indicates increasing upward momentum; if the histogram is negative (red) and continuously expanding, it indicates increasing downward momentum. Note that some software may double the value for easier observation, meaning the histogram = (MACD line - Signal line) × 2.
MACD indicator usage: How to use MACD to find buy/sell points?
The MACD indicator generally has two types of usage: crossover strategy and divergence strategy.
Crossover Strategy
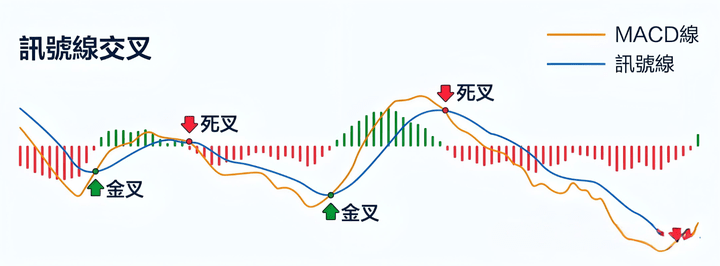
The crossover strategy is divided into golden cross and death cross, abbreviated as golden fork and death fork.
Golden Cross
A Golden Cross (Golden Fork) occurs when the MACD Line crosses above the Signal Line (the fast line crosses above the slow line). At this point, the histogram changes from negative to positive, with the color shifting from red to green, indicating a shift from bearish to bullish market conditions. A wave of upward movement may follow, serving as a potential buy signal.
Death Cross
Death Cross (Death Fork) occurs when the signal line crosses above the MACD line (the slow line crosses above the fast line). At this point, the histogram changes from positive to negative, with the color shifting from green to red, indicating a shift from bullish to bearish market conditions. A wave of downward movement may follow, serving as a potential sell signal.
Everyone should note that when identifying golden crosses and death crosses, the simplest and quickest method is not to look at the movements of the fast and slow lines but rather to observe the size and color changes of the histogram. When the histogram gradually shrinks and changes from red to green, it indicates a golden cross; conversely, when the histogram gradually shrinks and changes from green to red, it indicates a death cross.
Divergence Strategy
The divergence strategy is divided into bottom divergence and top divergence, also known as bullish divergence and bearish divergence.
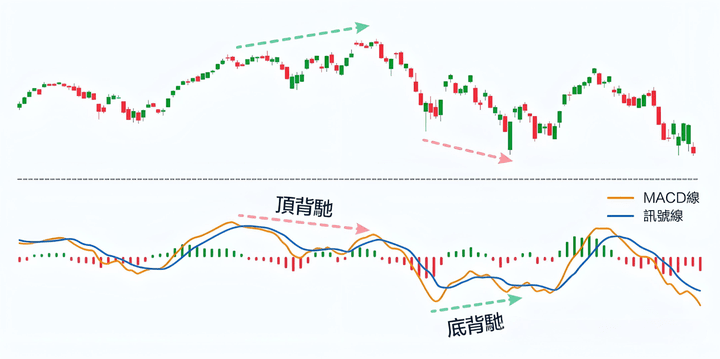
Divergence refers to the phenomenon where technical indicators and price trends diverge from each other. For leading indicators like MACD, since its movements precede price movements, if the two diverge, it means that the price may gradually correct afterward, allowing us to find buy/sell signals.
MACD Bottom Divergence
Bottom divergence occurs when the price falls below a previous low, while the MACD line (fast line) is above the previous low, indicating an upward trend. This suggests that the price may turn from falling to rising, serving as a potential buy signal.
MACD Top Divergence
Top divergence occurs when the price exceeds a previous high, while the MACD line (fast line) is below the previous high, indicating a downward trend, which suggests that the price may turn from rising to falling, serving as a potential sell signal.
MACD indicator usage: Common issues with the MACD indicator
The MACD indicator is very practical, but some beginners are prone to misconceptions and usage errors. Here, I will briefly help everyone clarify some related issues about MACD.
What is the difference between MACD and Moving Average (MA)?
MACD is called the Exponential Moving Average Convergence/Divergence in Chinese, and its name overlaps somewhat with Moving Average (MA), leading some people to feel confused.
In simple terms, MACD is an upgraded version of MA. Compared to MA, MACD has the following advantages:
First, MA generally refers to Simple Moving Average (SMA), while MACD uses Exponential Moving Average (EMA). The calculation method of EMA is slightly more complex than SMA, making it an improved version of SMA.
Second, MACD is calculated from the difference between two EMAs, which can reflect changes in trend and strength—this is a function that a single MA does not possess.
Third, MA is a primary indicator displayed on top of candlestick charts, while MACD is a secondary indicator generally displayed in an independent window below the candlestick chart, preventing overlap with other indicators that could clutter the candlestick chart.
Can MACD be used to assess overbought and oversold conditions?
Overbought and oversold refer to an imbalance of buying and selling forces in the short term, leading to excessive price increases/decreases, which may result in opposite trends occurring subsequently.
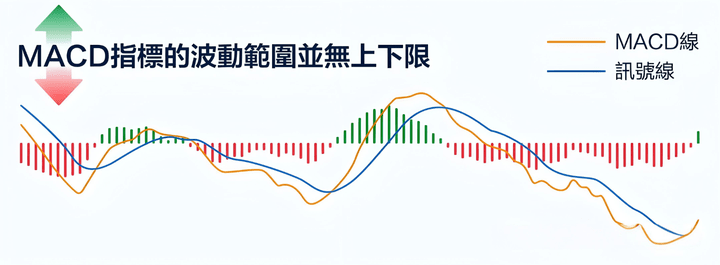
Many momentum indicators can be used to assess whether securities are overbought or oversold, such as the Stochastic Indicator (KDJ) and the Relative Strength Index (RSI). Some may mistakenly use MACD to assess overbought or oversold conditions, but this practice is inappropriate. The MACD indicator theoretically has no boundaries, making it difficult to define when the MACD exceeds a certain threshold, which could indicate a potential market reversal.
A more appropriate approach is to use the MACD indicator in conjunction with some overbought/oversold indicators. If the MACD and other technical indicators simultaneously release the same buy/sell signal, investors can have greater confidence in their trading decisions.
Finally, let me share a set of insights on cryptocurrency trading! Learning is understanding the way!
1. If you notice that the domestic market continues to decline during the day, you should consider bottom fishing because at 21:30, foreign capital will start pulling up the market.
2. Conversely, if the market rises sharply during the day, do not chase the highs; it is very likely to experience a pullback at night. Those who are used to FOMO must hold steady at this time.
3. The key signal during buying and selling is the 'pin', the deeper the pin, the stronger the buy or sell signal.
4. Before major meetings or the release of favorable news, the market usually rises, but after the news is released, there may be a decline.
5. When discussing trading plans in the group, those coins passionately promoted by group members often excite people but are likely to lead to losses. A counter-trend operation may be safer. Especially for those coins that are being heavily traded, it is better to take profits and avoid being overexposed.
6. If you are not interested in a coin recommended by group friends, it may actually rise significantly. When you start to have doubts, you might as well test it out; there may be unexpected surprises. For example, BGB was recommended by group friends when it was only 0.4, and now it has directly risen to 4.4; at that time, it was truly just a casual purchase.
7. The choice of platform is also very important; large exchanges like bn, ok, and bg are relatively stable, while recent dexx incidents show that there is nowhere to seek rights protection, and too many people have fallen victim. Many people are superstitious about non-small exchanges, but in reality, they are not authoritative, and no one endorses them; there are still many scams on them. Previously, a user encountered a witch; Bitget spent hundreds of thousands of dollars on Dogs and sent them to users who were targeted by the project's witch.
8. When you hold a large amount of a particular coin, the risk of liquidation increases because you may be targeted by the exchange and become part of the liquidation list. Once your stop-loss for a short position is triggered, the market often tends to fall, as if it is deliberately not allowing you to escape, as in the case of TRB.
The above are trading insights from ten years of cryptocurrency trading experience, having gone through many ups and downs. These are heartfelt words of profound understanding, and I hope they are useful to everyone. Products from Yan'an are guaranteed to be high quality. There are beautiful souls in the crypto world, unique and independent, with the spirit of the Tao and the art of currency management!
No matter how diligent a fisherman is, he will not go out to sea during a stormy season but will instead carefully guard his fishing boat. This season will eventually pass, and a sunny day will come! Follow me, and I will teach you both how to fish and the art of fishing. The cryptocurrency world is always open; by going with the trend, you can lead a life in tune with the flow. Save this and keep it in mind!
