
Written by: UkuriaOC, CryptoVizArt, Glassnode
Translated by: AididiaoJP, Foresight News
Ethereum's price continues to strengthen, moving towards its historical high, while Bitcoin is consolidating below its peak. However, the surge in open contracts for mainstream altcoins, combined with the unusually low volatility expectations for Bitcoin, lays the groundwork for increased volatility in the digital asset market.
Abstract
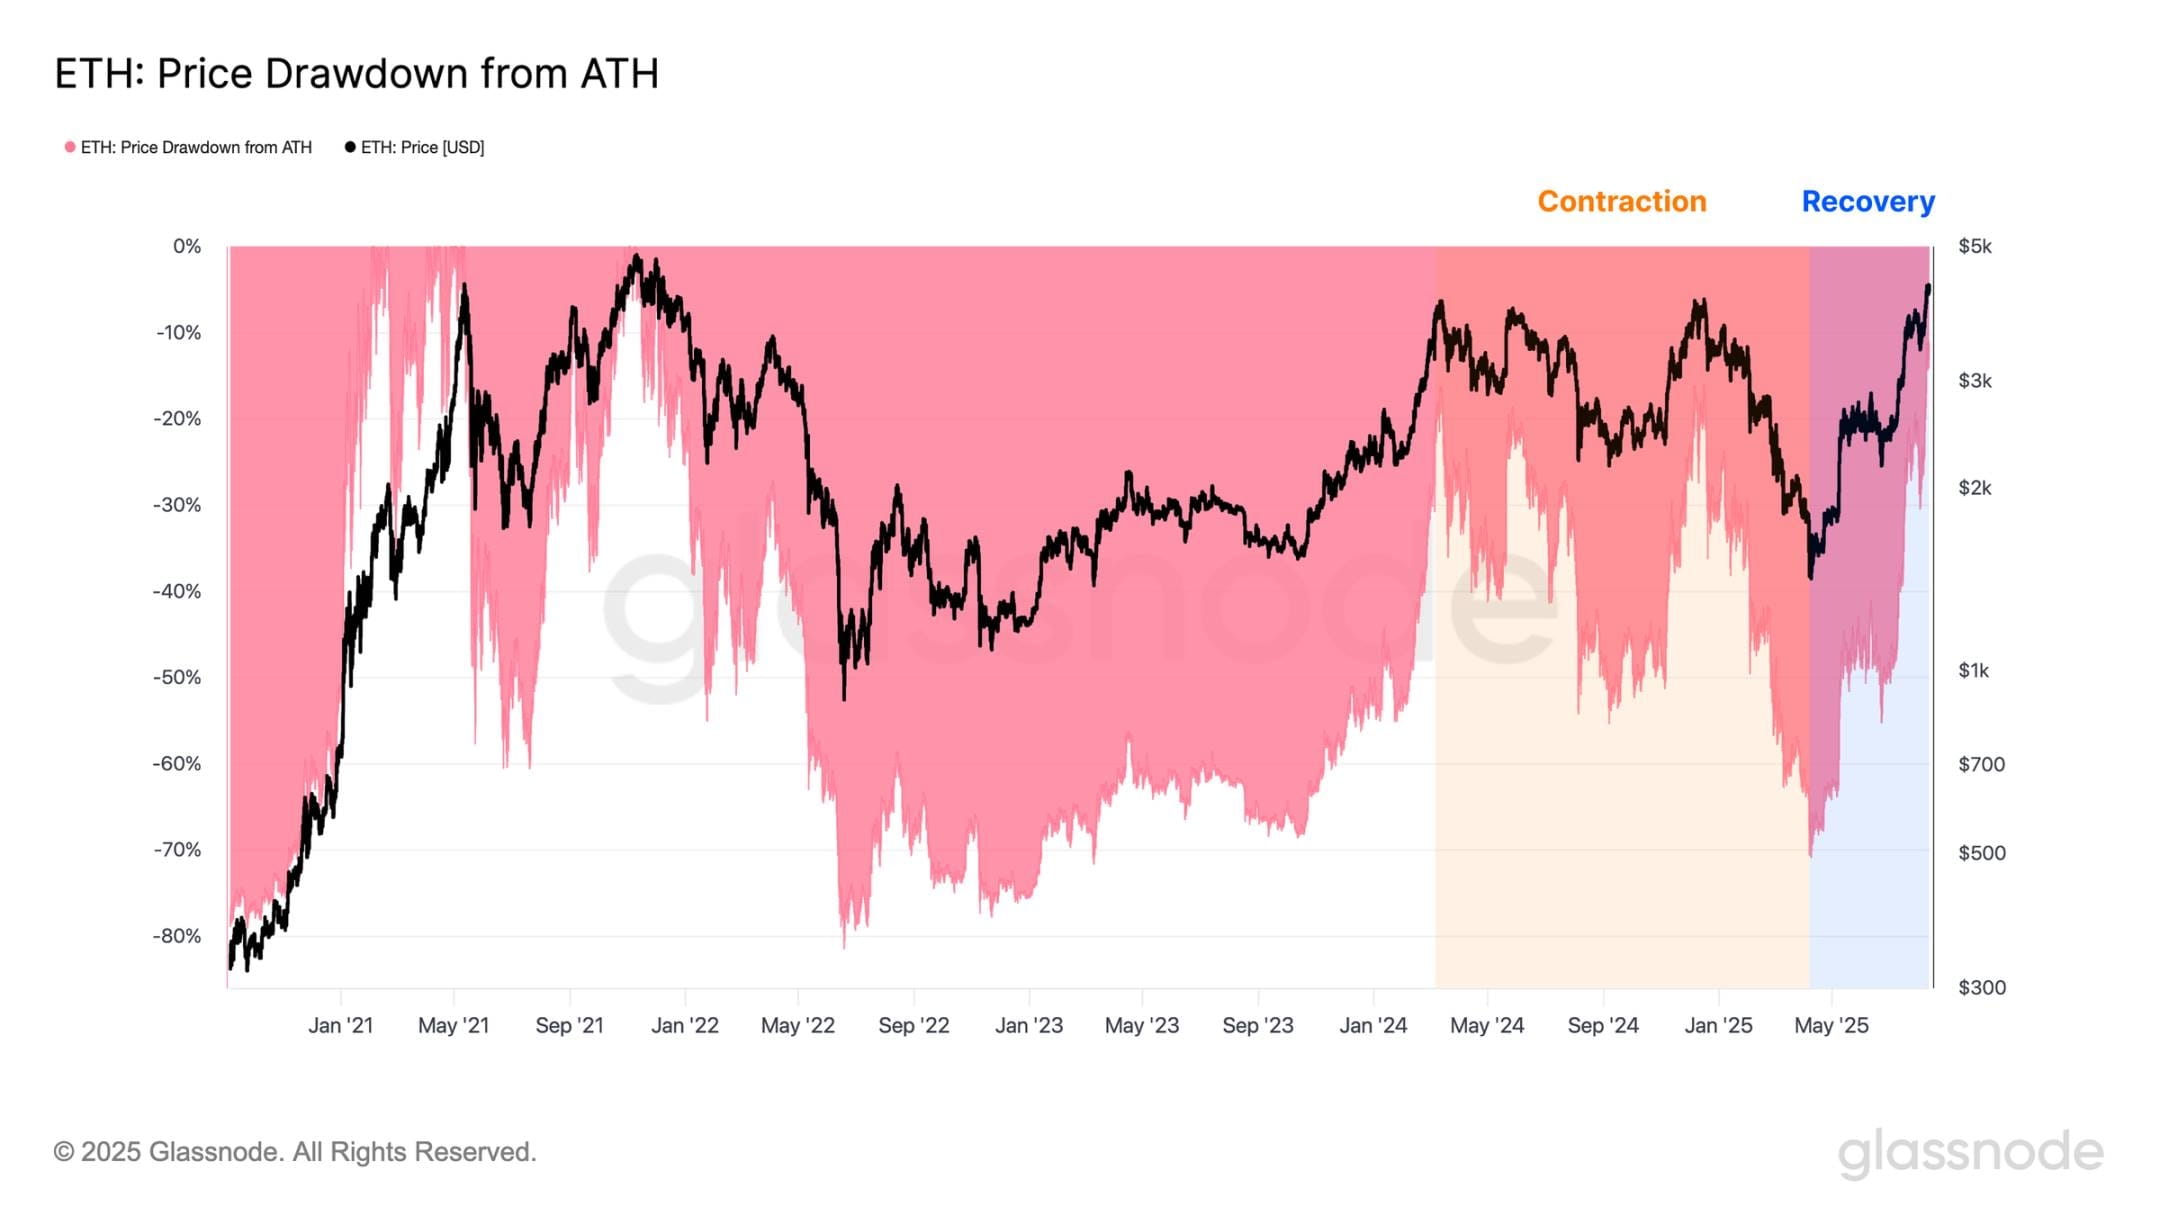
Ethereum's rally continues to accelerate, with its price reaching $4,600, the highest level since December 2021, just about 5% below its previous all-time high. However, speculation around this leading altcoin is increasing, driving the total open contracts for mainstream altcoins to a record $47 billion. This accumulation of leverage creates a more volatile backdrop for the market, with price shocks becoming increasingly reflexive in their impact.
Key on-chain indicators for Bitcoin show that its momentum remains strong. Short-term holders experienced significantly lower actual losses during the recent pullback to $112,000, while the vast majority of investors remain in profit.
Options traders continue to bet on a low-volatility mechanism, with at-the-money implied volatility (IV) across all maturities at multi-year lows. Historically, periods of abnormally low implied volatility often foreshadow sharp increases in actual volatility, which can be seen as a contrarian signal.
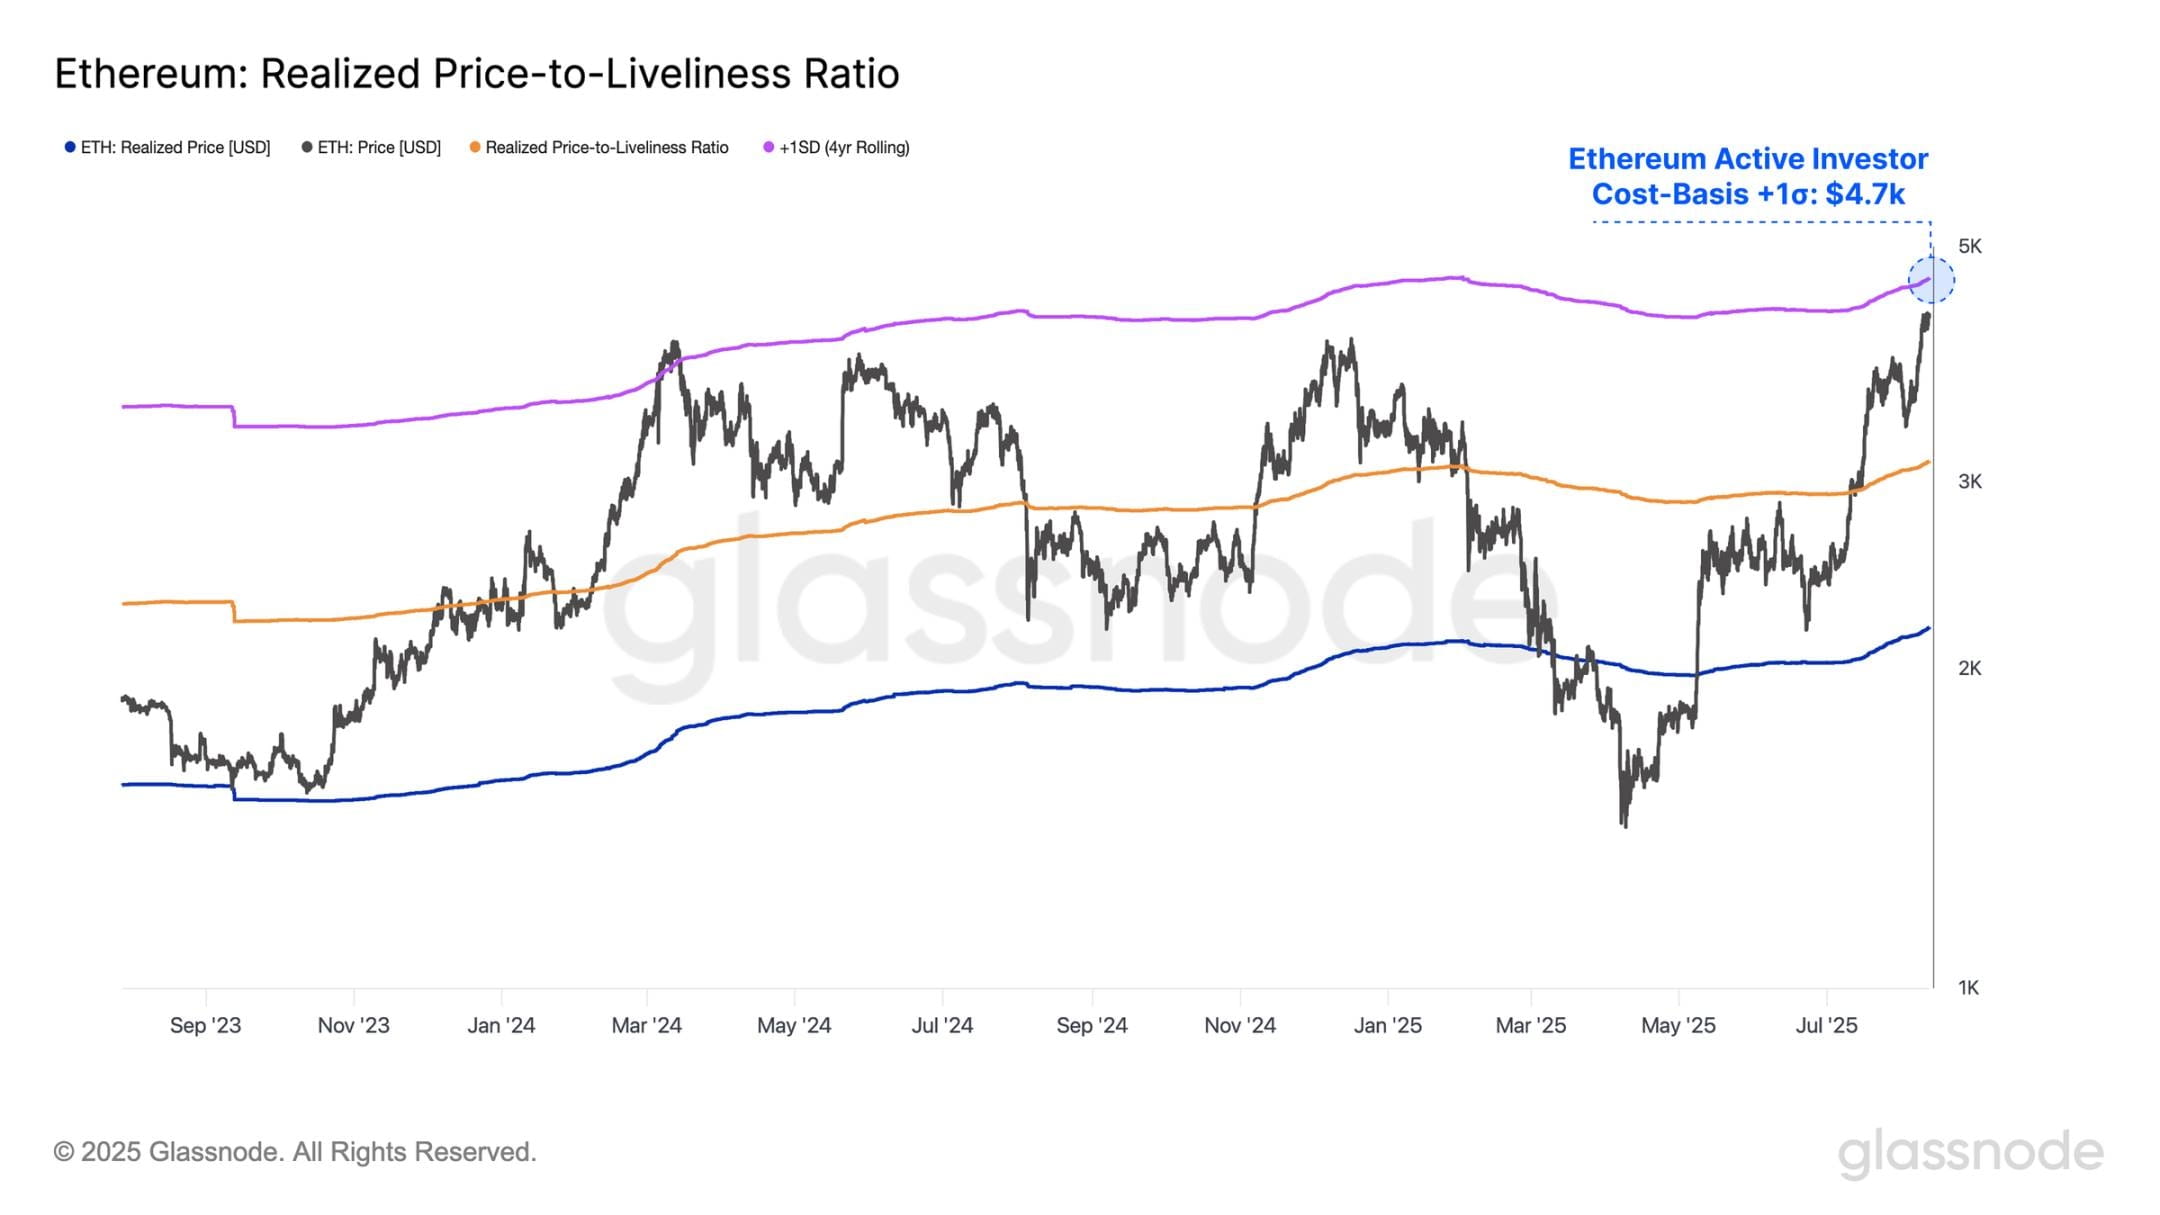
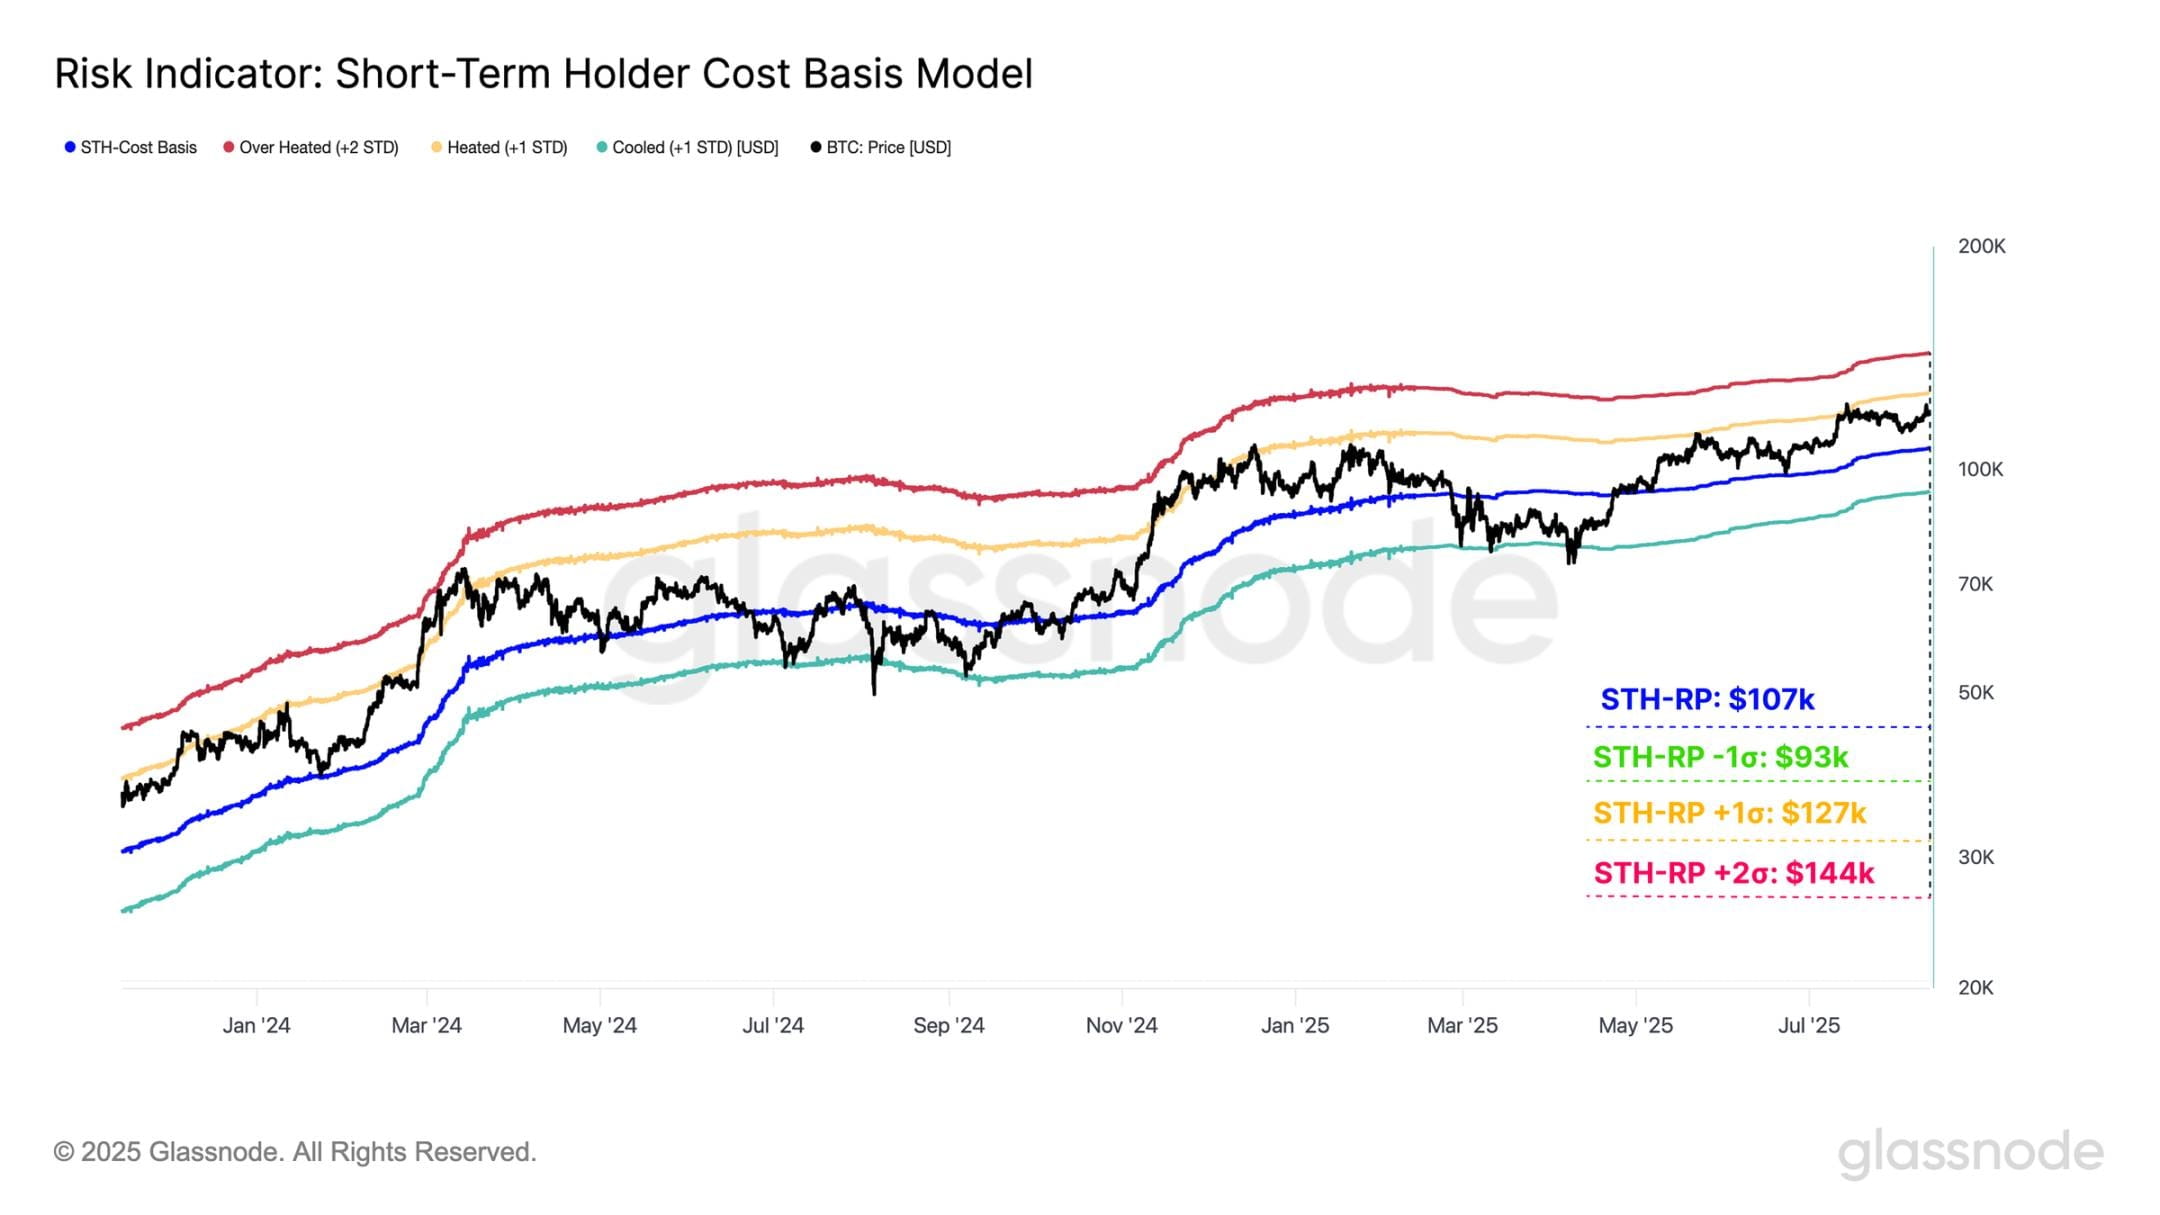
Ethereum is approaching its +1σ active realized price level of $4,700, an area that has historically triggered strong selling pressure. Meanwhile, Bitcoin is nearing its +1σ (one standard deviation, meaning the larger the σ, the more volatile the price) short-term holders' cost basis of $127,000, a level that has consistently served as a cyclical resistance point. If Bitcoin can decisively break through this level, it may open the channel for further price increases to the +2σ level of $144,000.
Note: The σ level helps traders identify historical price boundaries, with +1σ being a key short-term resistance level; if broken, it may challenge higher standard deviation levels (such as +2σ). Prices reaching +2σ typically indicate an overheated market (e.g., over-leveraged investors), necessitating caution against retracement risks. The same applies below.
The rise of altcoins
The rally in the digital asset market continues to accelerate, with Ethereum leading the way. Its price has climbed from $1,500 in April to $4,300, the highest level since December 2021, just 5% below its all-time high of $4,800. Historically, Ethereum has been a bellwether for the broader altcoin performance, and its recent strong performance is driving investors to speculate further along the risk curve.
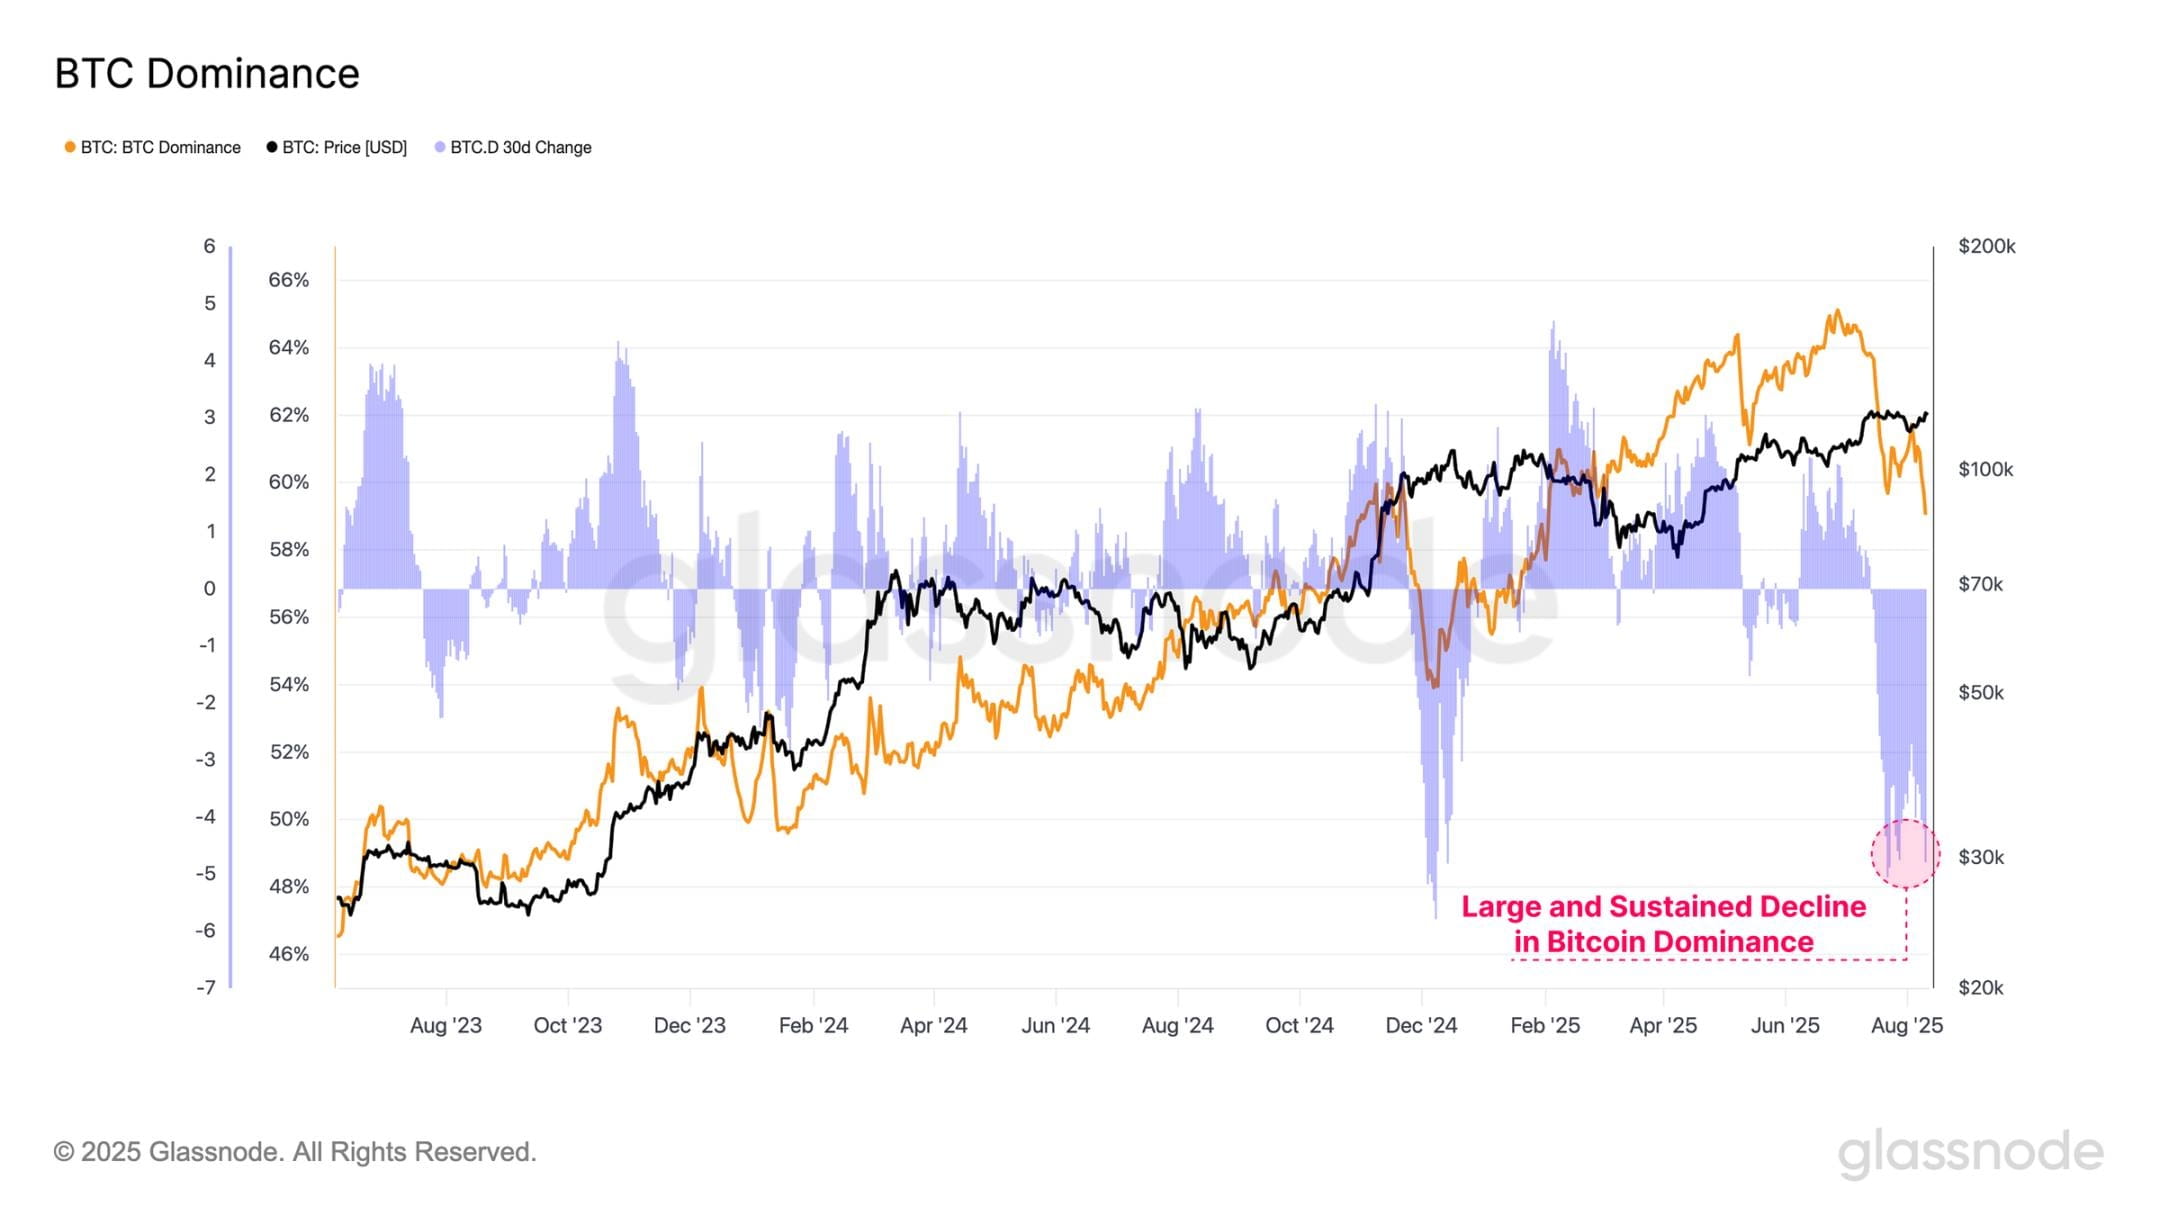
This rotation of funds is also reflected in the Bitcoin dominance metric, which measures Bitcoin's share of the total market capitalization of digital assets. Over the past two months, Bitcoin's dominance has dropped from 65% to 59%, highlighting that funds are flowing further into high-risk assets.
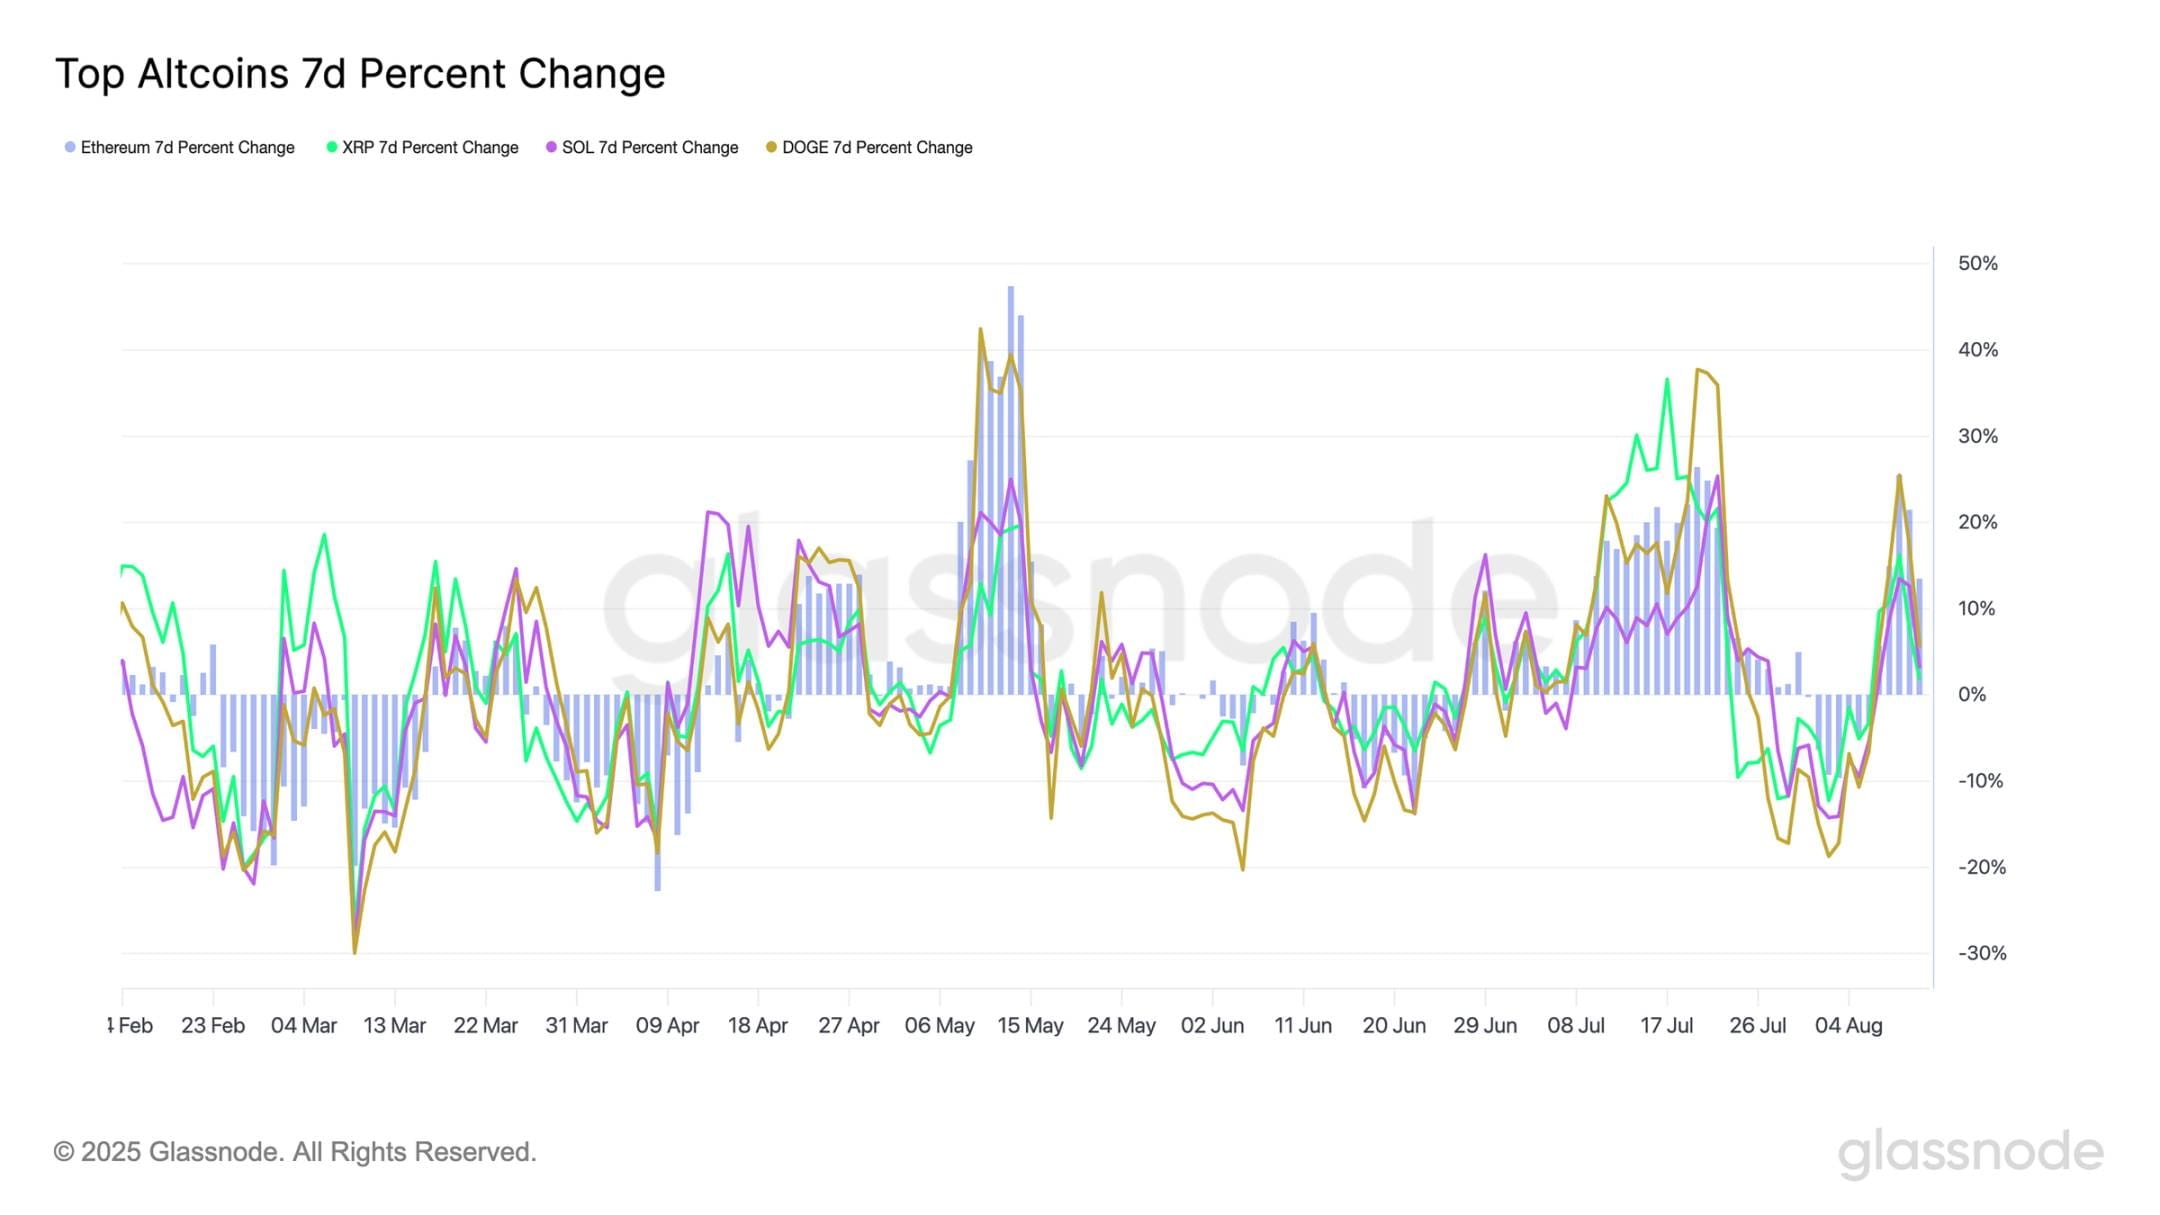
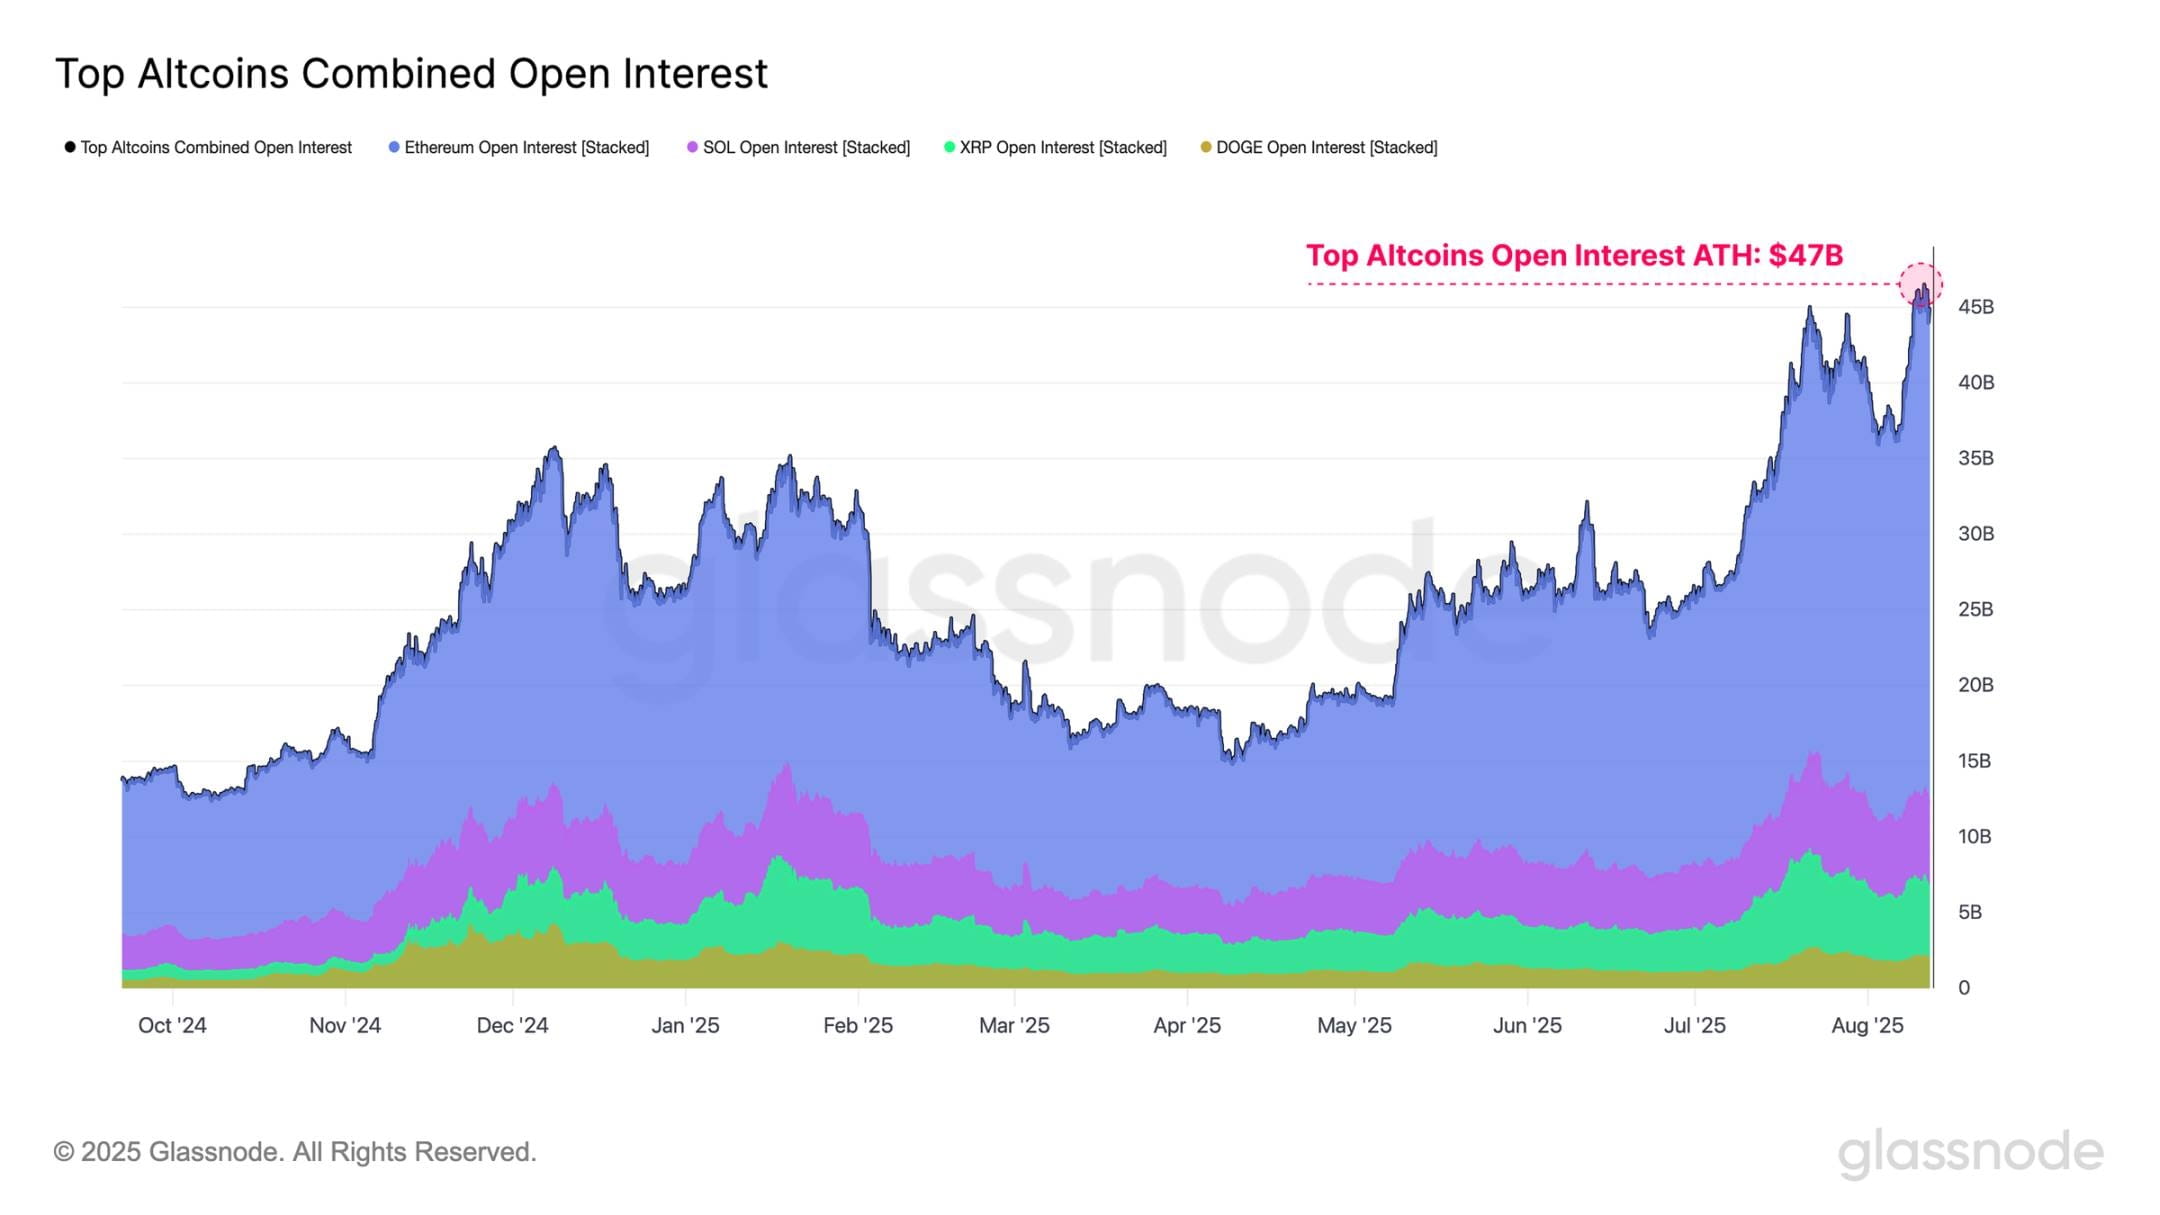
By observing the 7-day percentage changes of mainstream altcoins (Ethereum, XRP, Solana, and Dogecoin), we can see that during July and August, these assets exhibited strong gains multiple times:
Ethereum 7-day increase: +25.5%
XRP 7-day increase: +16.2%
Solana 7-day increase: +13.6%
Dogecoin 7-day increase: +25.5%
These gains indicate that as investor speculative activity intensifies, altcoins are experiencing a comprehensive rally.
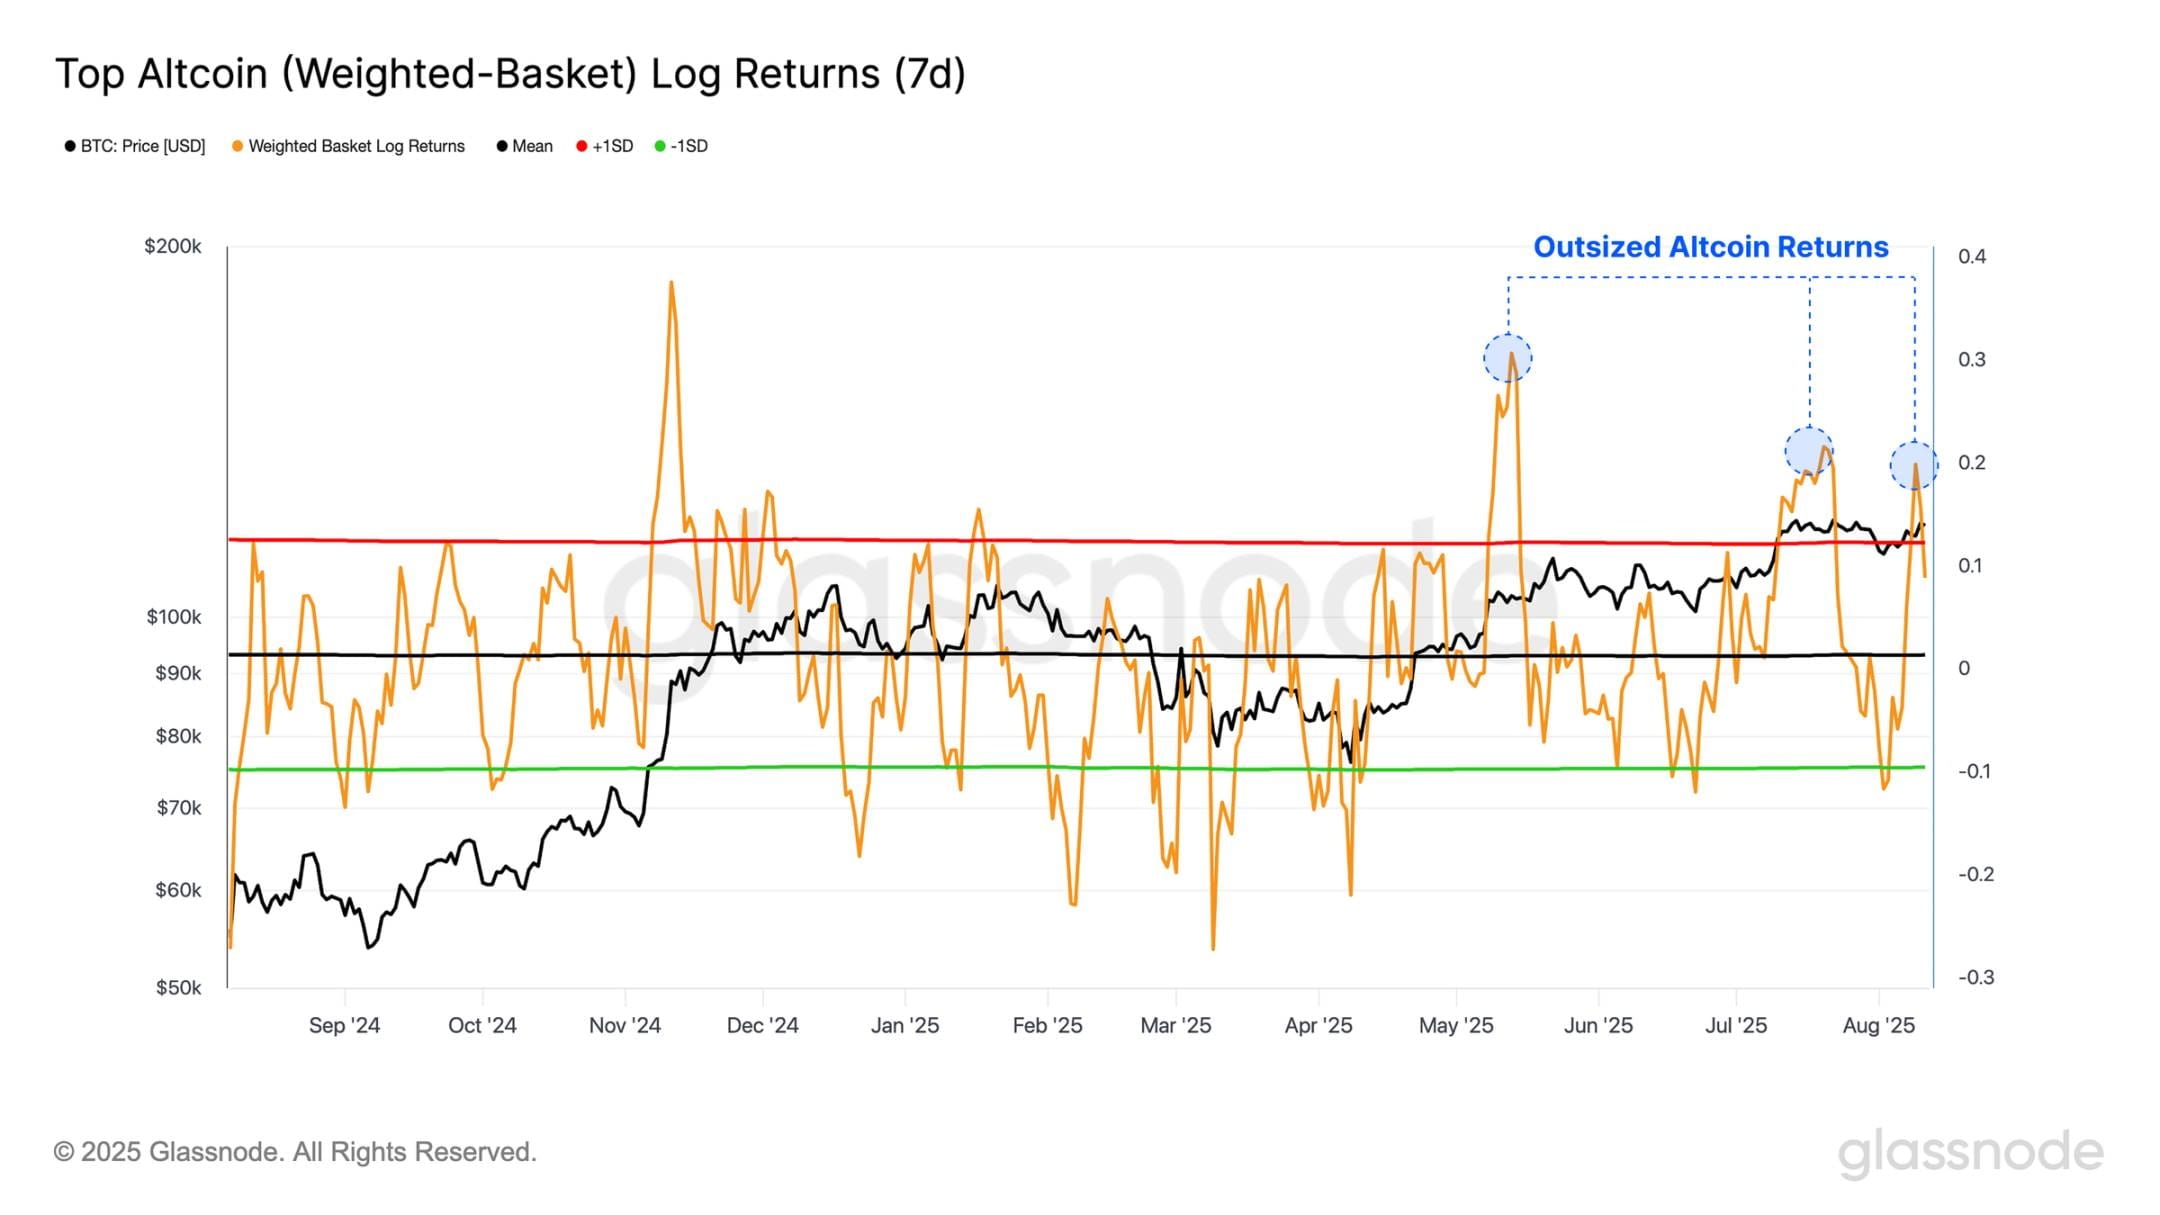
Another way to measure the performance of mainstream altcoins is to construct a market cap-weighted basket of altcoins and assess its 7-day logarithmic return. This method naturally eliminates the impact of differences in asset sizes. By applying the ±1σ range, we can identify statistically significant periods of outperformance or underperformance. Over the past four months, this approach has revealed three sustained periods of outperformance, highlighting the excess returns in the altcoin space.
Significant price volatility in mainstream altcoins has driven the total open contracts to a new high of $47 billion. These conditions suggest that leverage is accumulating in the market, making it more susceptible to sharp price fluctuations. High leverage can amplify uptrends as well as exacerbate downturns, creating a more reflexive and vulnerable market environment.
Turning Point
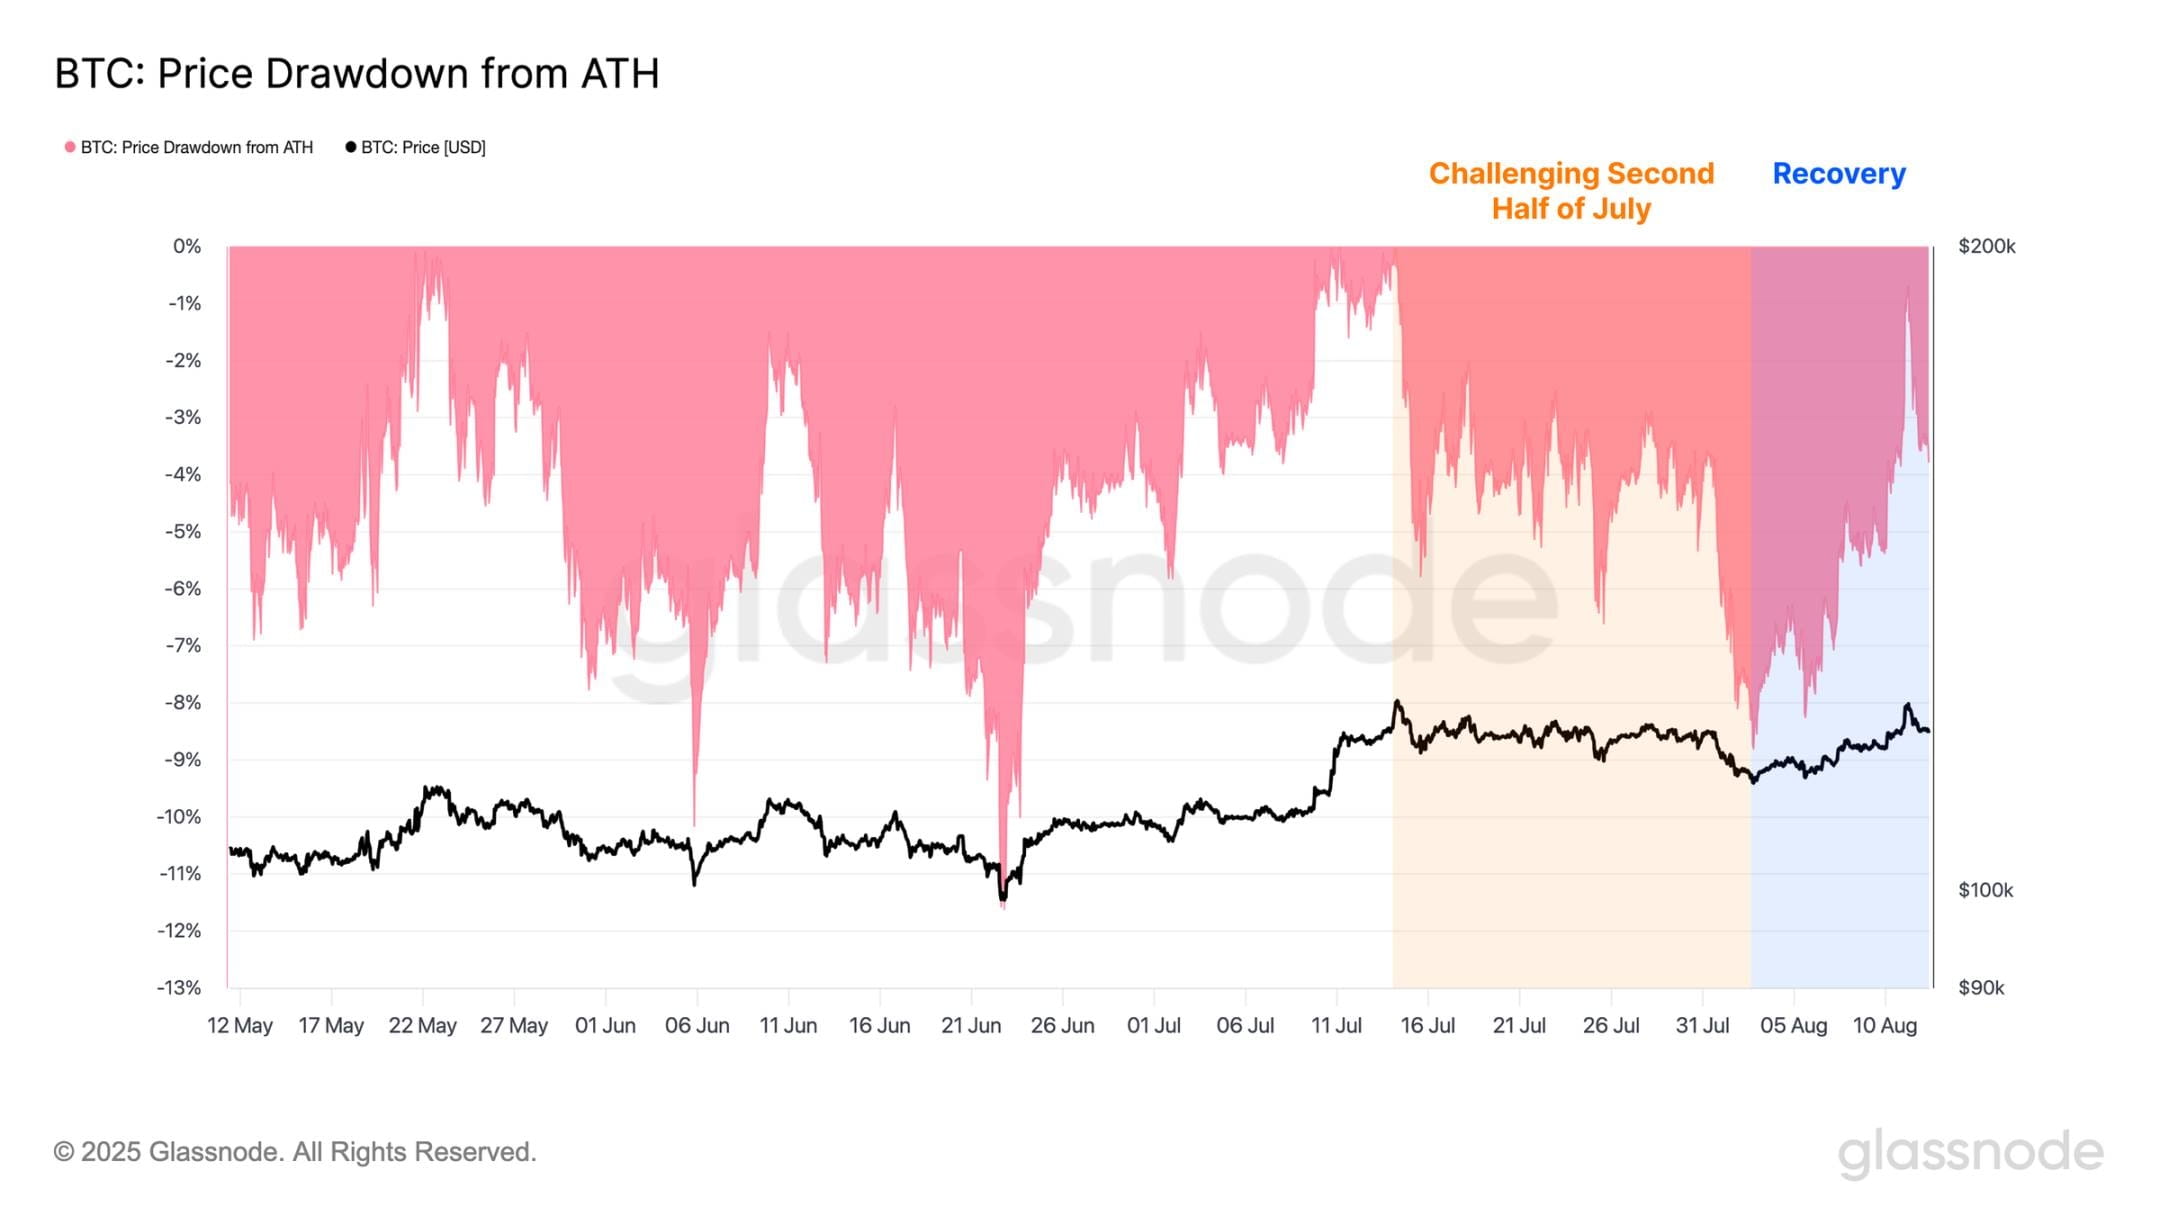
In contrast, Bitcoin has consistently outperformed most altcoins throughout the cycle, but faced challenges in the latter half of July, dropping to $112,000, a decline of 9%, and entered a low liquidity gap area. Since then, Bitcoin has rebounded strongly and is currently only 1% below its all-time high, indicating that the market is attempting to enter a new round of price discovery.
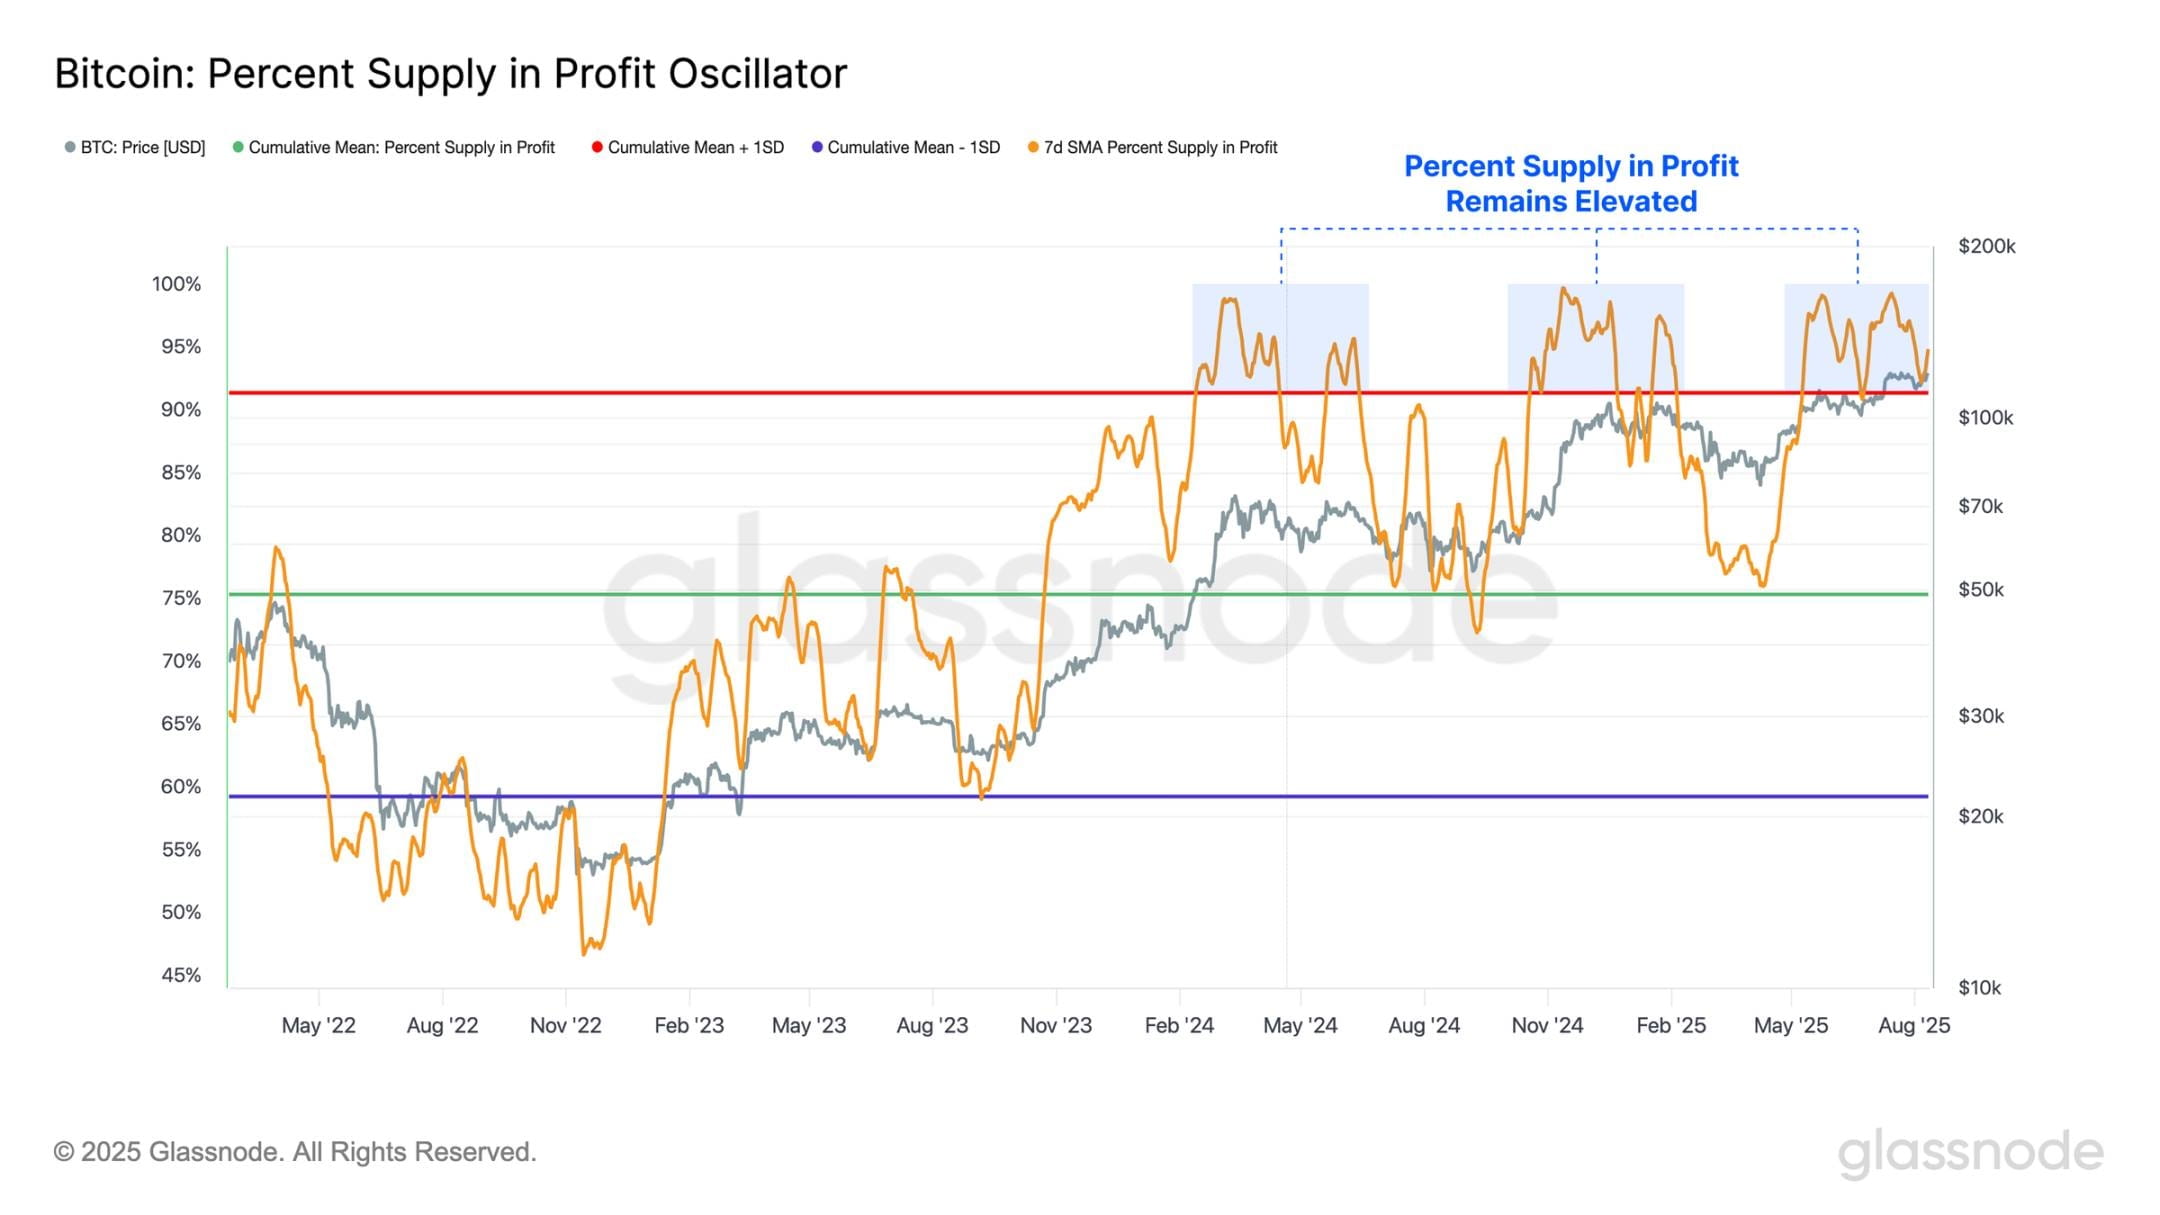
Recent upward momentum is supported by strong on-chain fundamentals. During the pullback, the proportion of circulating supply in profit has remained resilient, finding support at its +1σ level. This indicates that the vast majority of investors (95%) are still holding unrealized profits.
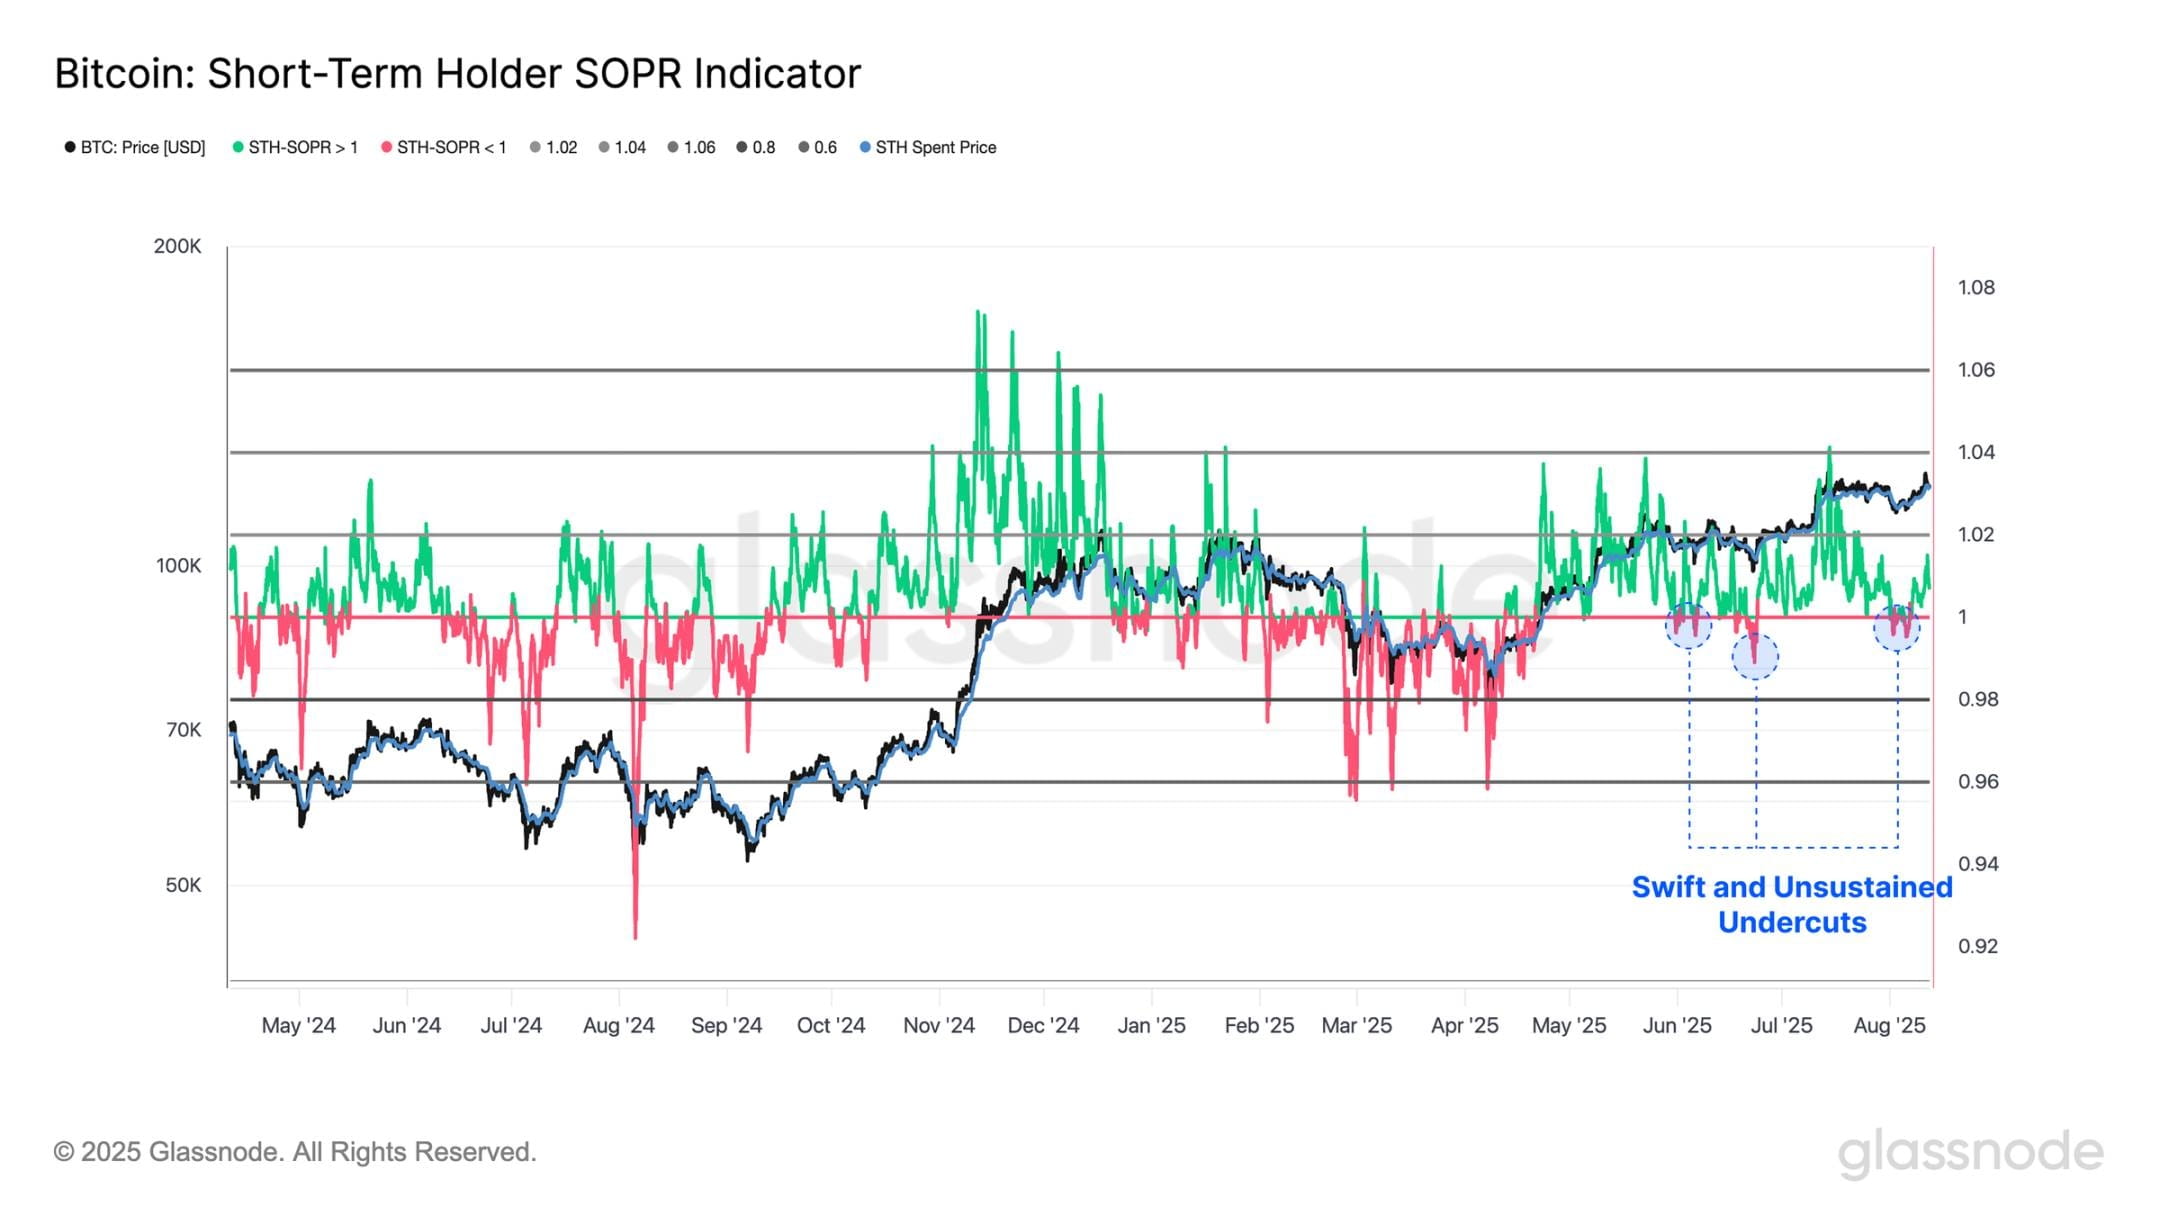
In the recent market downturn, the spending output profit ratio (SOPR) of short-term holders has returned to the equilibrium level of 1.0, briefly and slightly falling below this level. This pattern indicates that new investors have been actively defending their cost basis, despite the sharp deterioration of market structure, resulting in relatively limited actual losses.
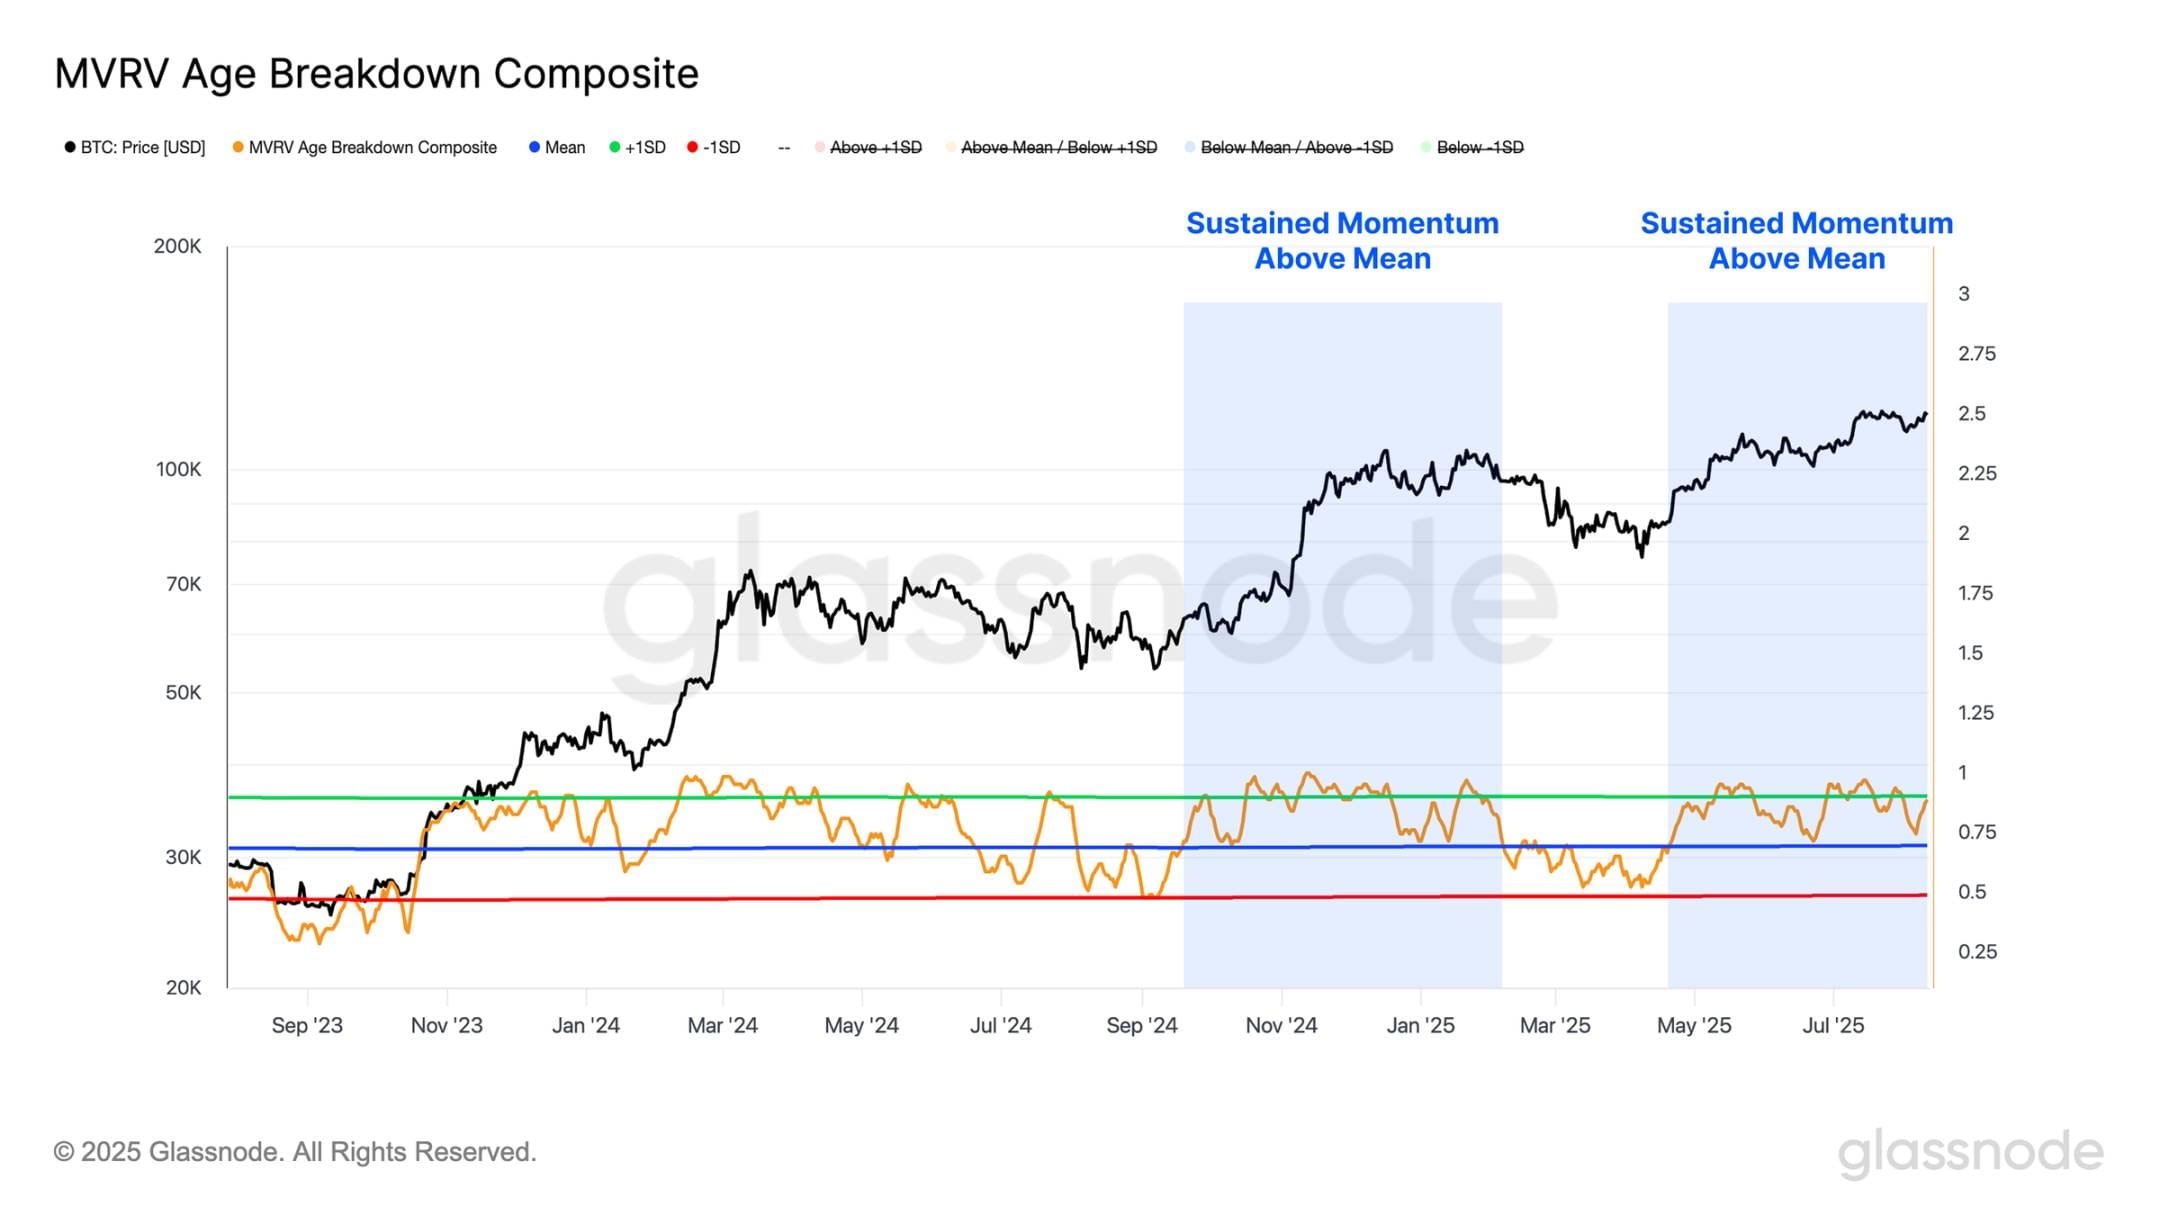
Additionally, we can use an equal-weighted portfolio to measure the average profit ratio of tokens held by investors of different ages. This provides an intuitive market momentum indicator by tracking the timing of an increasing number of investors transitioning from unrealized profits to unrealized losses.
During the recent adjustment, the oscillation has remained above the mean and found strong support at this level, indicating that most investors have remained profitable during the decline. Combined with the marginal losses reflected by the SOPR indicator for short-term holders, this suggests minimal selling pressure from market participants. Maintaining this threshold marks an improvement in market conditions and provides a constructive backdrop for continued upward momentum.
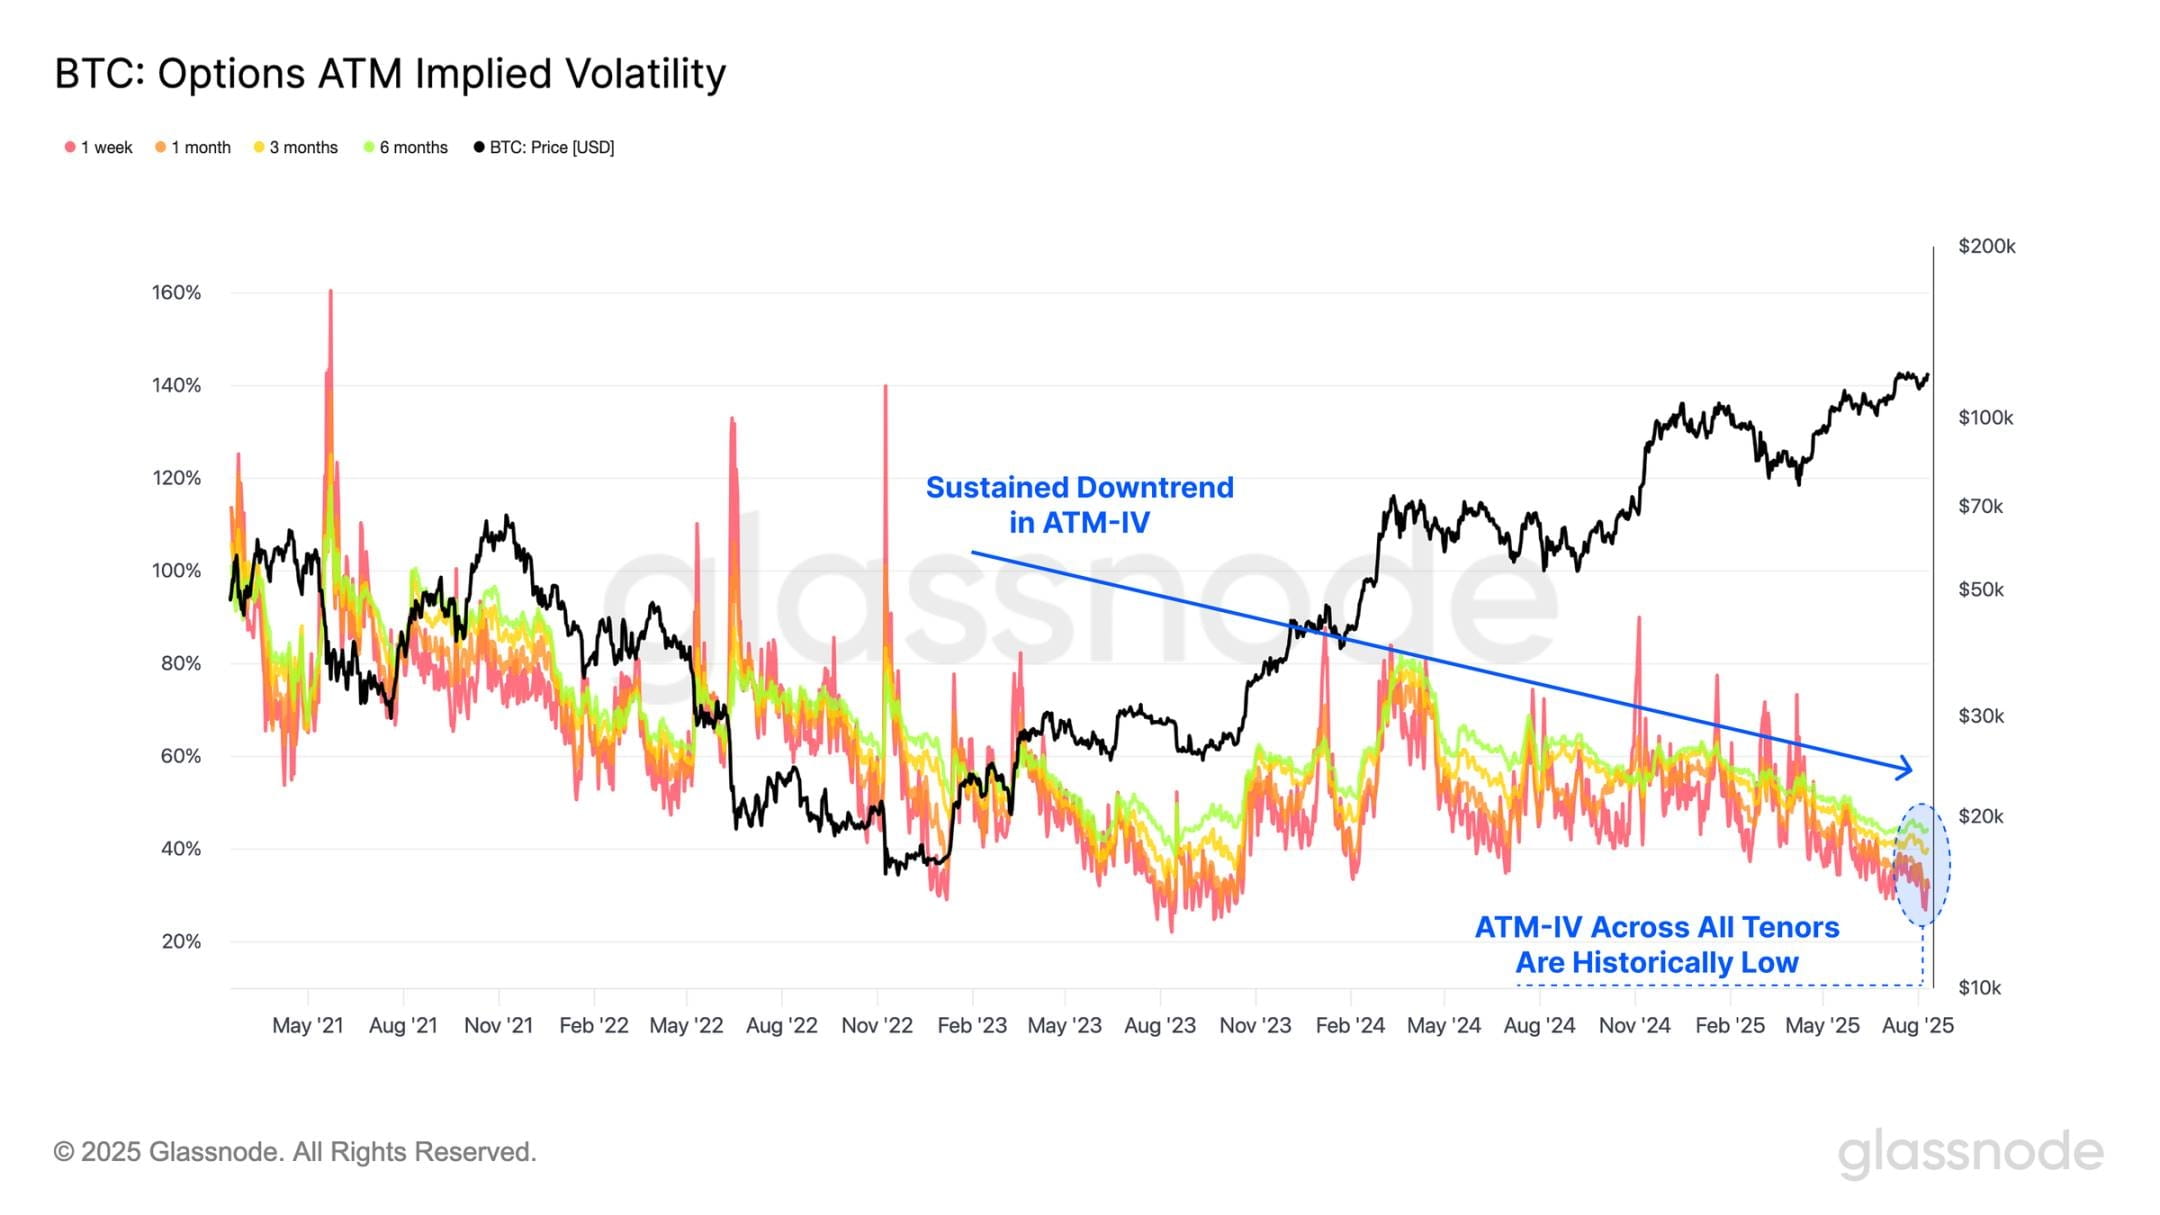
Implied volatility continues to contract
Turning to the options market, at-the-money implied volatility (ATM IV) remains on a sustained downward trend, indicating that traders do not anticipate a shift in the market towards high volatility mechanisms. Historically, this subdued volatility expectation often foreshadows significant market upheaval, making it a potential contrarian indicator.
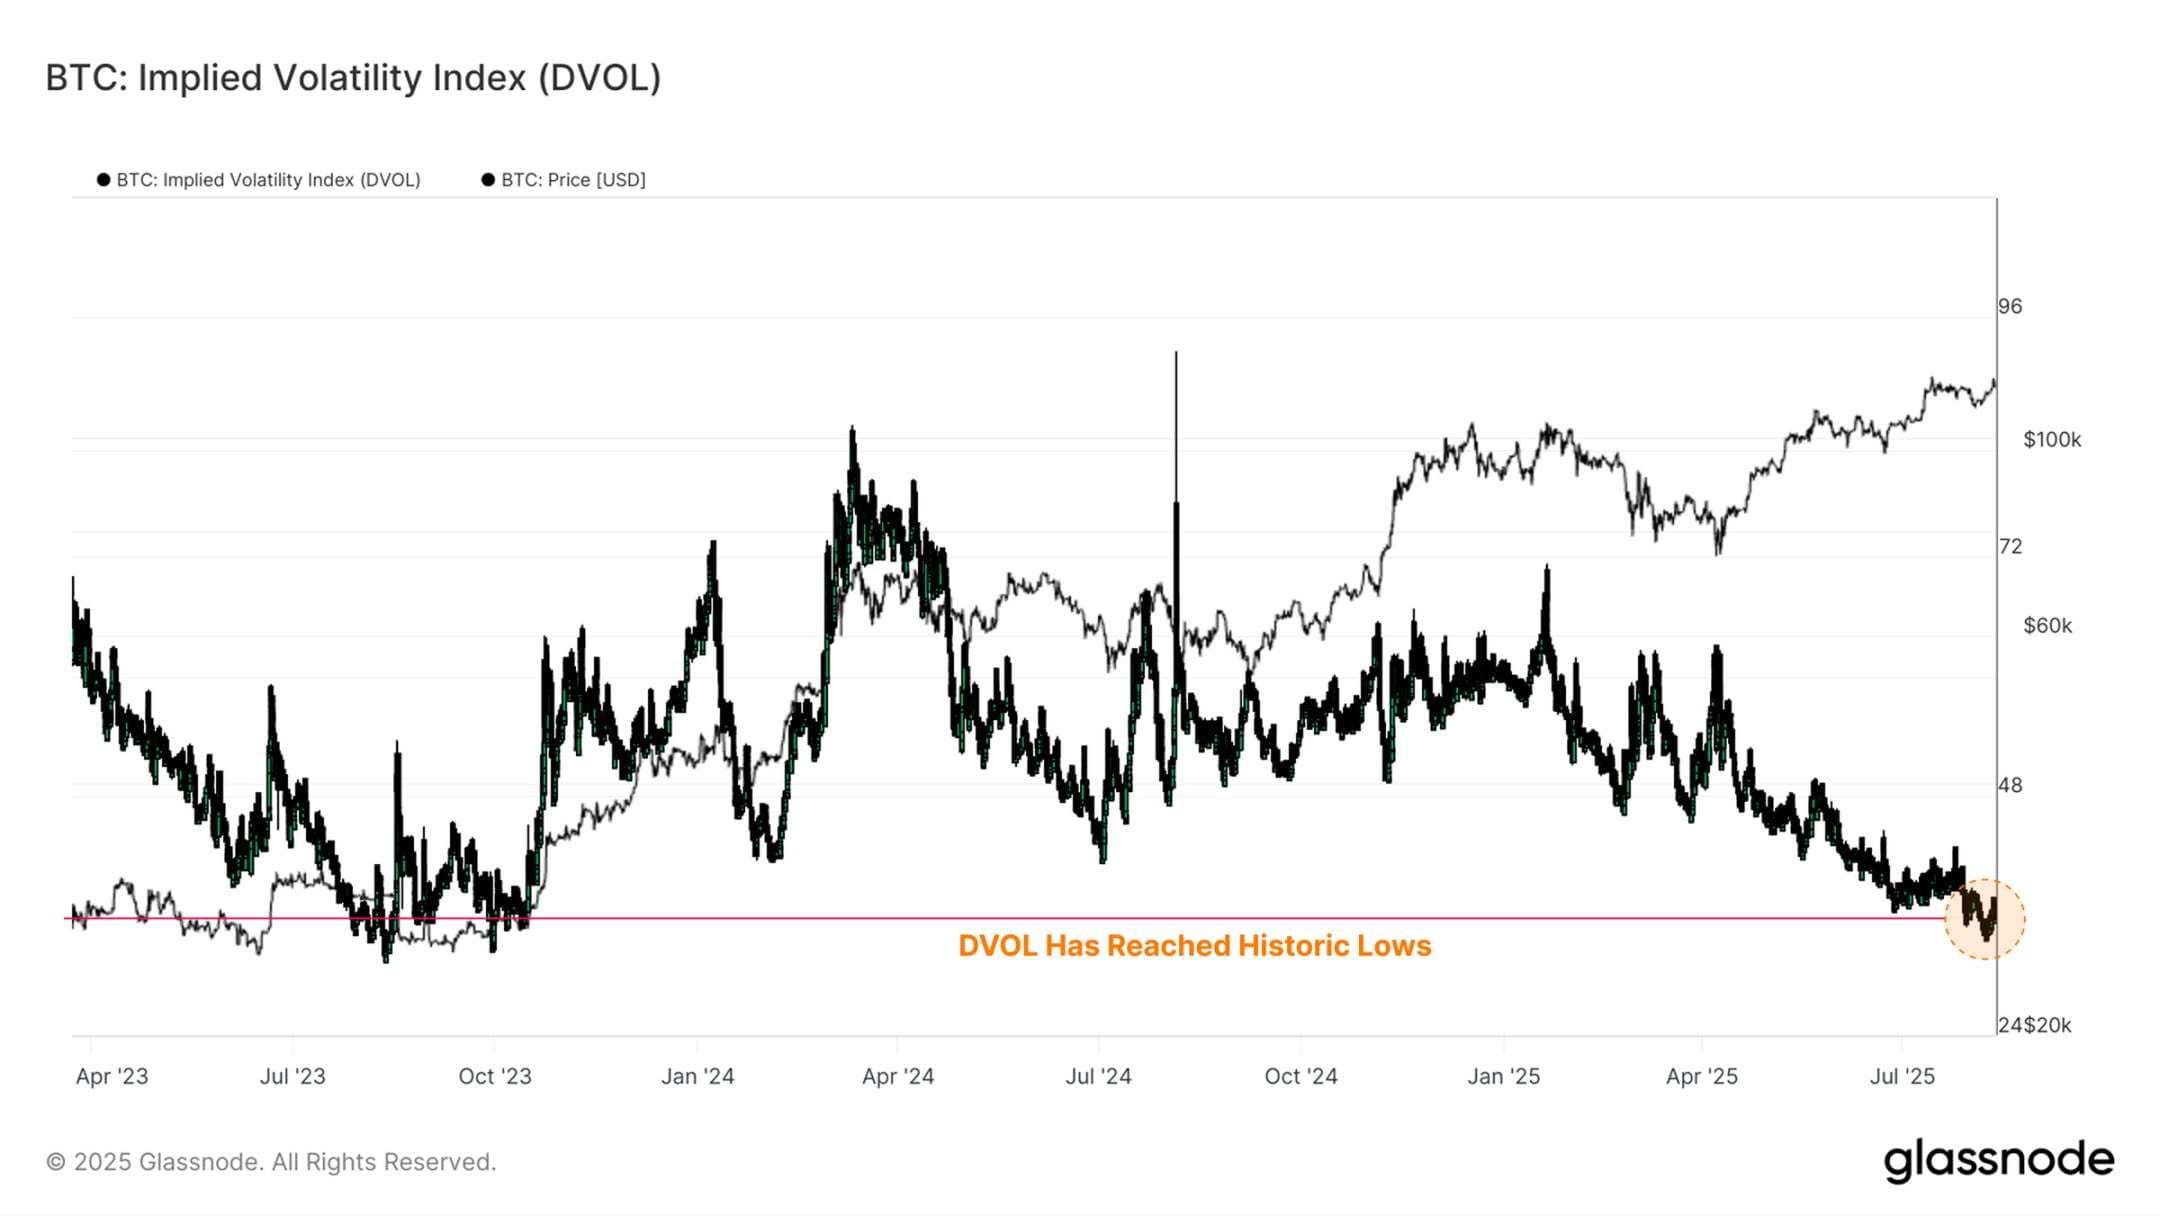
Additionally, we can further validate the above observations through Deribit's DVOL index. This index is a 30-day implied volatility measure based on options data across all strike prices, not just at-the-money options. Similar to the VIX index in the stock market, it provides a broad perspective on market sentiment and expected price volatility, helping traders assess risk and identify periods of increased speculation or uncertainty.
The current DVOL reading is at a historical low, with only 2.6% of trading days having lower values than the current level. Such levels usually reflect market complacency and a lack of demand for hedging against significant volatility. While this situation may persist, if a catalyst occurs, the market will be susceptible to sudden fluctuations, as evidenced by the violent disorderly price movements that occurred when risks were rapidly repriced in past cycles.
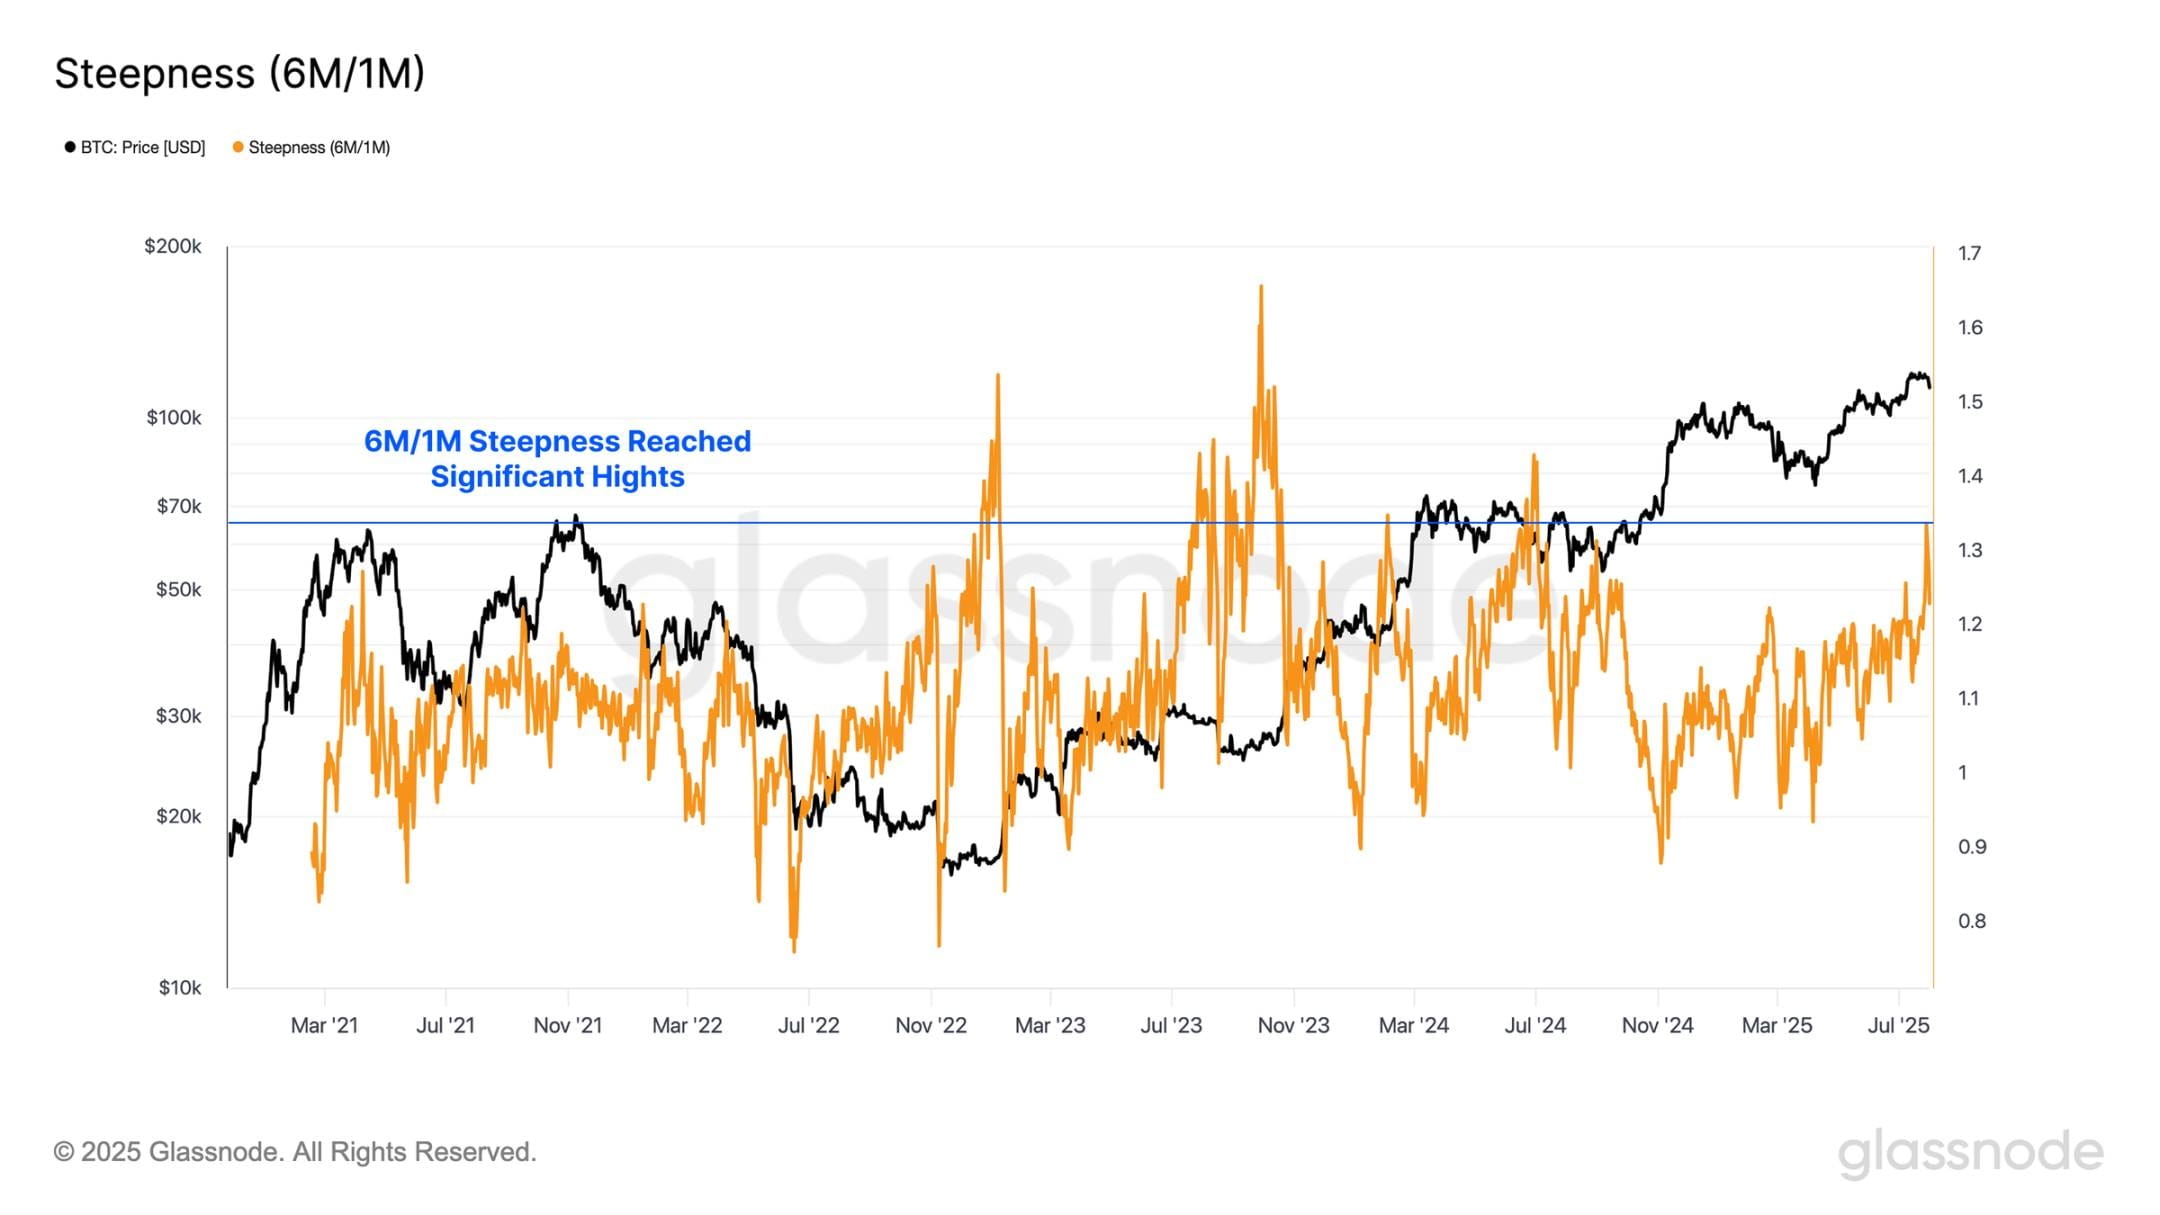
Moreover, we can track the 6-month / 1-month implied volatility ratio to assess how market volatility expectations change over time. Changes in this ratio can reveal whether traders believe risks are concentrated in the near term or further out, thereby helping to identify shifts in sentiment and the anticipated timing of market pressure or exuberance.
Currently, the 6-month / 1-month implied volatility ratio is high, with only 3.2% of trading days having readings above the current level. This indicates that options traders believe long-term uncertainty is significantly higher than short-term, suggesting a substantial increase in volatility expectations for the next two quarters.
Market Navigation
To assess the potential upside targets of Ethereum's current rally, a useful reference point is its active realized price at the +1 standard deviation level, which typically marks the beginning of selling pressure. Currently, this threshold is $4,700, which may represent an overheated area under current market conditions.
This level is historically significant, serving as a strong resistance level during the rally in March 2024, and has repeatedly acted as a resistance level during the 2020-2021 bull market cycle. In the past, when Ethereum has broken through this range, it has typically been accompanied by heightened investor sentiment and a fragile market structure.
In light of these dynamics, the $4,700 price point is a critical resistance level that requires close attention. A decisive breakthrough could signal the market entering a more speculative phase, but if sentiment reverses, it could also increase the risk of a sharp correction.
In contrast, for Bitcoin, we can assess the cost basis of short-term holders (STH), which represents the average purchase price of new market participants. Historically, this key price level marks the boundary between local bull and bear markets. By applying standard deviation ranges, we can evaluate whether the market is overheated or oversold.
From the perspective of these pricing levels, $127,000 becomes a key level to watch closely. If the price continues to rise, the market's reaction to this level will be crucial. Additionally, if Bitcoin decisively breaks through $127,000, it may set a target towards the $144,000 area, where the +2σ range coincides with a major resistance level, potentially triggering a sharp increase in selling pressure.
Summary and Conclusion
The market as a whole is in a sensitive phase of high speculation and low volatility contradictions, necessitating caution against short-term reversal risks. The current digital asset market shows polarization: Ethereum is strongly rising, approaching historical highs, driving a broad altcoin rally, but open contracts have surged to $47 billion, indicating accumulated leverage and rising market vulnerability; Bitcoin is consolidating at high levels, with robust on-chain indicators, but implied volatility in the options market has hit multi-year lows, indicating potential for sharp volatility risks.
The strong performance of the digital asset market continues, with Ethereum surging to $4,600, the highest level since December 2021, currently just 5% below its all-time high, while Bitcoin's momentum is still strongly supported by robust on-chain fundamentals.
The strong price performance of altcoins has driven a surge in open contracts for mainstream altcoins, totaling a record $47 billion, increasing the likelihood of significant price fluctuations. In contrast, the Bitcoin options market remains priced in a low-volatility environment, with implied volatility at multi-year lows, a setting that historically often precedes sudden expansions of actual volatility.
The two major mainstream coins are currently approaching historically significant resistance levels: Ethereum is at the +1σ level of its active realized price of $4,700, while Bitcoin is at the +1σ level of the short-term holders' cost basis of $127,000. Price developments near these thresholds will be crucial in determining whether the market moves towards higher cyclical targets or faces a sharp correction driven by leverage.