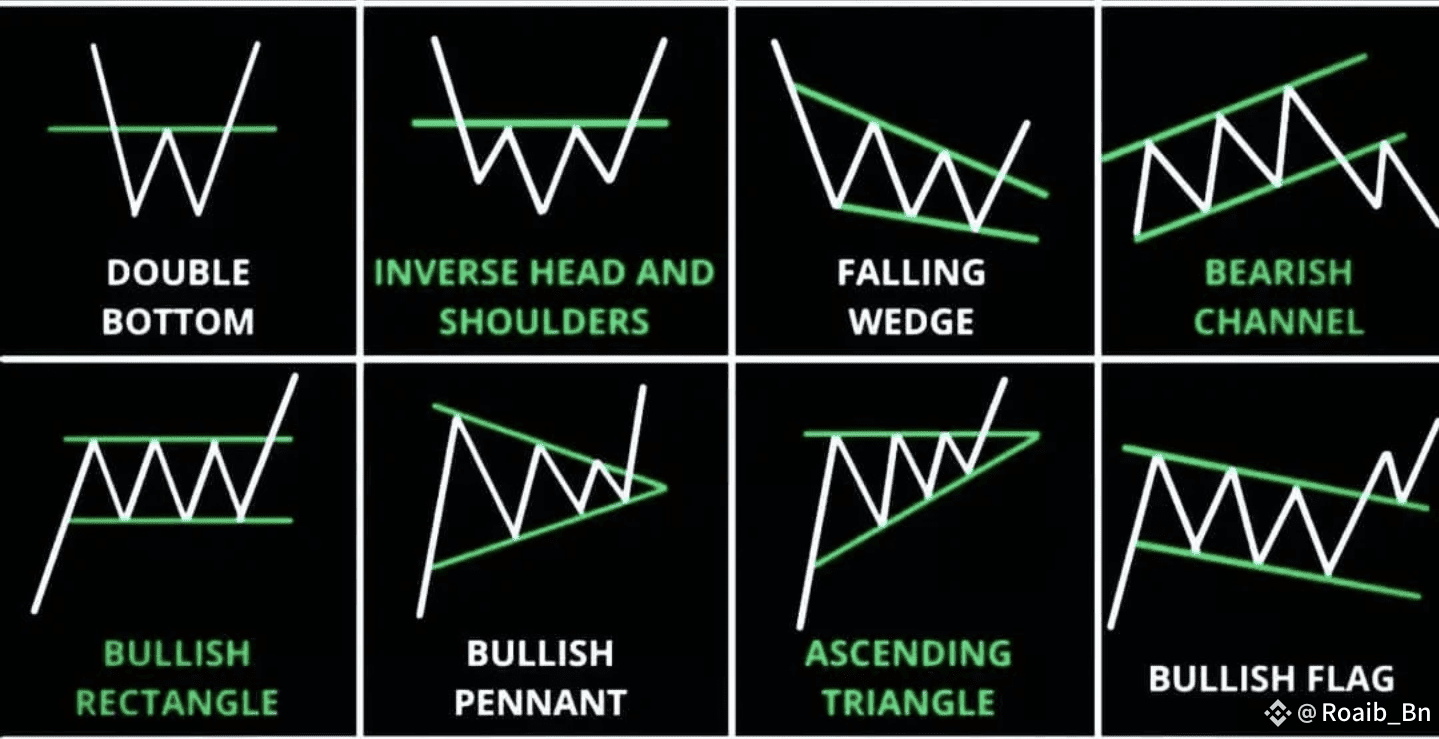
1️⃣ Double Bottom ⏳📊
Looks like the letter W. Appears after a downtrend and signals a reversal upward. 💹
---
2️⃣ Inverse Head & Shoulders 🪖
Three dips: the middle is the deepest. When the neckline breaks, prices often surge. 🚀
---
3️⃣ Falling Wedge 📉➡📈
Price squeezes downward into a narrow range before breaking upwards. Bullish momentum building! 💪
---
4️⃣ Bearish Channel (Bullish Break) 📏📊
Even though it’s called bearish, when price breaks above the channel, it’s a bullish signal. ✅
---
5️⃣ Bullish Rectangle 📦💎
Price moves sideways within two parallel lines before a powerful upward breakout.
---
6️⃣ Bullish Pennant 🏴🔥
Short consolidation after a big move up. Usually followed by another strong rally.
---
7️⃣ Ascending Triangle 🔺📈
Flat resistance on top, rising lows below. Shows buyers are getting stronger—breakout coming! 💥
---
8️⃣ Bullish Flag 🚩💹
Small downward sloping channel after a rally. Often leads to another big upward wave.
---
💡 Pro Tip:
Always confirm patterns with volume spikes 📊 and avoid fakeouts by setting proper stop-losses. ⚠️
📌 Save this guide & share it with fellow traders! 💬
If you found this helpful, follow, like, and comment to support the community. 🙌🔥
HERE is the candles image 👇
IF you find the post helpful then please follow like and comment on it thanks 👍
#DeFiGetsGraded #CPIWatch #BTCOvertakesAmazon #BTCReclaims120K #BinanceAlphaAlert