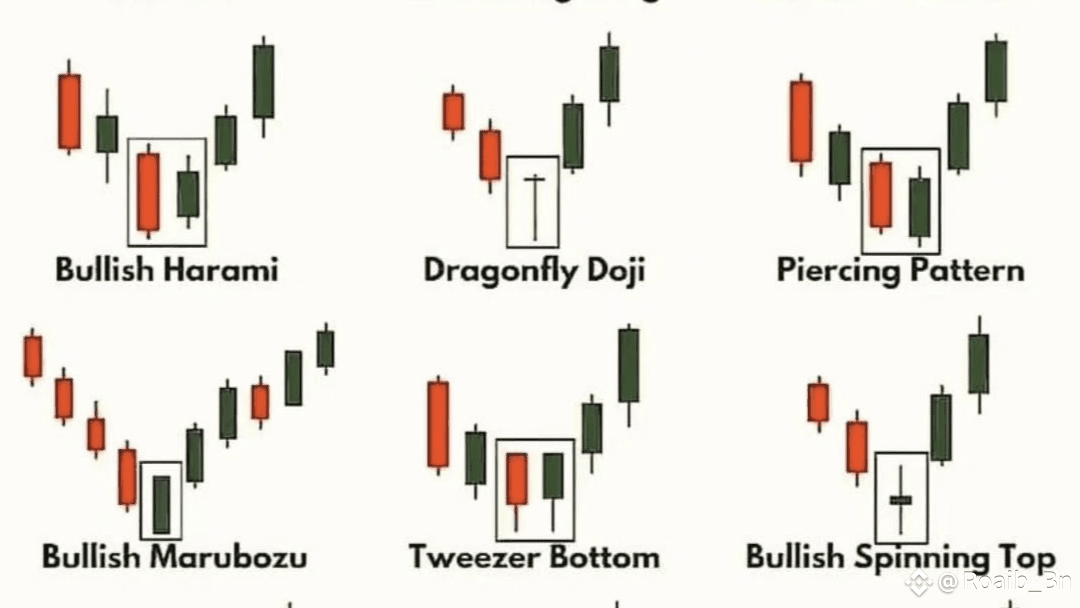
🔹 1. Bullish Harami
Structure: Small green candle inside the body of a previous red candle.
Meaning: Selling pressure is weakening, buyers may take control.
Action: Look for confirmation with the next candle.
---
🔹 2. Dragonfly Doji
Structure: Long lower wick, no upper wick, small or no body.
Meaning: Sellers pushed price down, but buyers regained control.
Action: Enter after a bullish candle confirms the reversal.
---
🔹 3. Piercing Pattern
Structure: Red candle followed by a green candle closing above the midpoint of the first.
Meaning: Strong buying pressure after a downtrend.
Action: Best used with support zone confirmation.
---
🔹 4. Bullish Marubozu
Structure: Large green candle with no shadows (full body).
Meaning: Strong buying dominance and momentum.
Action: Indicates possible trend continuation.
---
🔹 5. Tweezer Bottom
Structure: Two candles with equal lows, one red and one green.
Meaning: Support holding firmly, reversal likely.
Action: Use as a confluence with other bullish signals.
---
🔹 6. Bullish Spinning Top
Structure: Small body with equal upper and lower shadows.
Meaning: Market indecision turning into bullish momentum.
Action: Wait for a breakout candle before entry.
---
📷 Here’s the candlestick patterns image for reference:
---
💡 Pro Tip: Always combine candlestick patterns with support/resistance, volume analysis, and trend direction for higher accuracy.
👍 If you found this helpful, follow, like, and comment to get more free trading guides!
#REVABinanceTGE #ETH5kNext? #ETHRally #DeFiGetsGraded #CPIWatch
