
1. What is the liquidation heatmap
1. Features of the liquidation heatmap
The liquidation heatmap is a tool that intuitively displays the distribution of potential liquidation orders in the market. It captures the open data of high-leverage traders in the market, showing where there are large potential liquidation orders in which price ranges.
● Liquidation orders: Refers to orders that result from extreme price fluctuations, causing high-leverage traders to exhaust their margins, leading trading platforms to automatically close positions or enforce liquidation.
● The triggering logic of liquidation: The higher the leverage, the closer the liquidation price is to the entry price. This often concentrates liquidation at certain key price points, forming 'liquidity pools'. These areas are targets for venture capital firms and market manipulators because they represent potential concentrated capital flow opportunities.
The liquidation heatmap relies on publicly available open order data from exchanges. By calculating the open interest and high leverage distribution for each price range, it can derive the density of potential liquidation areas. The system usually uses color depth to mark this density:
● The darker the color → indicates that the area has gathered more potential liquidation orders.
● The lighter the color → indicates that the area has less or no significant potential liquidation funds.
2. AiCoin liquidation heatmap
AiCoin's liquidation heatmap presents liquidation risk areas in a professional and intuitive manner, providing users with important references to identify potential market volatility points in advance:
● Real-time dynamic updates: The system updates the liquidation heat distribution in real-time during trading hours to ensure the timeliness of the data.
● Supports cross-platform analysis: The liquidation heatmap supports multiple mainstream exchanges and contract varieties, with a wide data coverage.
● Intuitive color: Uses light green, yellow, purple-red, and other color gradients to mark liquidation strength, helping investors quickly locate key areas.
Application scenarios:
1. High leverage area warning: Helps investors avoid hedging positions in high-risk liquidation areas, reducing losses caused by unprepared operations during market fluctuations. At the same time, it avoids setting their liquidation price at concentrated liquidation areas, reducing the risk of liquidation.
2. Main force behavior reference: Market makers or large capital usually use the liquidation liquidity pool to achieve their trading intentions. The liquidation heatmap can help identify these 'liquidity hunting points', allowing investors to anticipate potential actions of large funds.
3. Auxiliary technical analysis: Combined with other technical indicators (such as support/resistance levels), the liquidation heatmap can provide auxiliary validation to confirm possible major trend target levels.
By reasonably using the liquidation heatmap, investors can respond more calmly to sudden market fluctuations, gaining an advantage in risk management and opportunity capture.
AiCoin - Heatmap liquidation chart - Access tool:
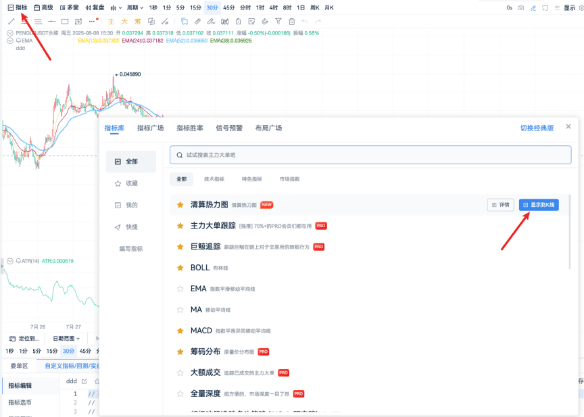
1) Open the liquidation heatmap tool page, channel: AiCoin PC terminal, click on indicators in the upper left corner, select the first indicator
2) Select trading pairs (currently only supporting USDT perpetual trading pairs for BTC, ETH, and SOL on Binance and OKX)
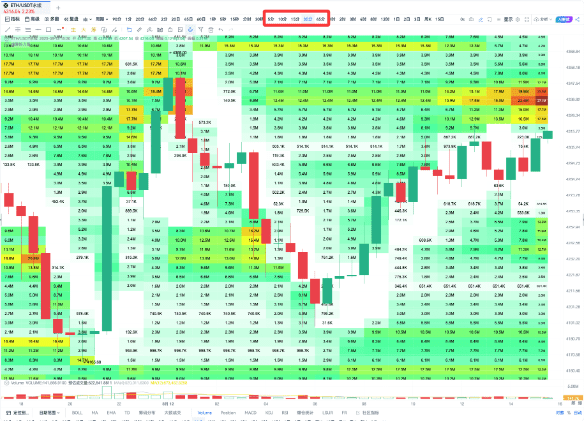
3) Select time periods (recommended 5 minutes - 45 minutes)
 2. Core usage of the liquidation heatmap: 1. 'Magnetic area': Attracts prices closer
In the liquidation heatmap, the darkest areas often correspond to the regions with the most concentrated liquidity, known as 'liquidity pools' or 'magnetic areas'.
● These areas are usually where liquidation orders are most concentrated, exhibiting extremely high capital flow density.
● Market prices have a natural tendency to gravitate towards these 'magnetic areas'. The reason is that the liquidity abyss attracts prices, and traders along with large funds often drive prices to gather in these areas, triggering market liquidation.
Strategy tips:
● When the heatmap shows a magnetic area of concentrated liquidation orders close to the current price in a certain direction, investors can view it as a short-term price target or medium-term directional guidance. For example, if there is a large concentration of liquidation orders for short positions above the price, the market may be pushed upwards to trigger these liquidation orders; the opposite is also true.
● Note that the closer you get to the magnetic area, the more intense the short-term fluctuations, but once the breakout occurs, the direction becomes clearer. At this time, it is necessary to respond according to market sentiment.
Example:
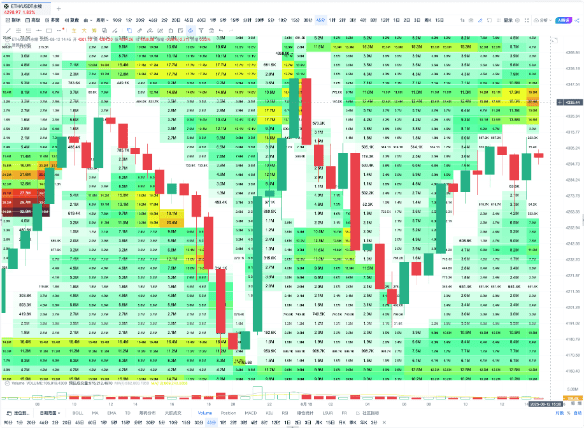
Chart OKX-ETHUSDT perpetual contract 45-minute cycle
Above the latest price:
Price: $4335.23, the liquidation area has formed a dark color area, indicating that a short-term magnetic area has formed at that position, easily attracting short-term prices to approach that location. At this time, the price may experience a slight upward movement in the short term.
2. 'Reversal area': Forms price support or resistance
The liquidation dense area not only 'attracts prices' but often forms new support or resistance after triggering liquidation, becoming a 'reversal area'. The emergence of such areas mainly stems from the resonance between some funds and technical signals after market price fluctuations.
● Price reaches the upper high liquidation area → Potential resistance level (bearish signal)
When the price rises rapidly and approaches the upper magnetic area, due to a large number of short positions being liquidated, liquidity is released. However, the bullish momentum may wane, and the price may get stuck or retreat near this position.
● Price reaches the lower high liquidation area → Potential support level (bullish signal)
Similarly, when the price retraces and reaches the lower magnetic area, a large number of long positions are forcibly closed, releasing bearish momentum, and subsequently, the price may generate rebound momentum.
Strategy tips:
● Clear direction: Observe the market's 'tracking trajectory' through heat distribution, clarifying the current price's position within the magnetic area (near, far, crossing).
● Corresponding verification: Combined with volume indicators (trading volume, capital flow) and support/resistance and other traditional technical analysis tools, it can enhance the reliability of confirming reversal signals.
Example:
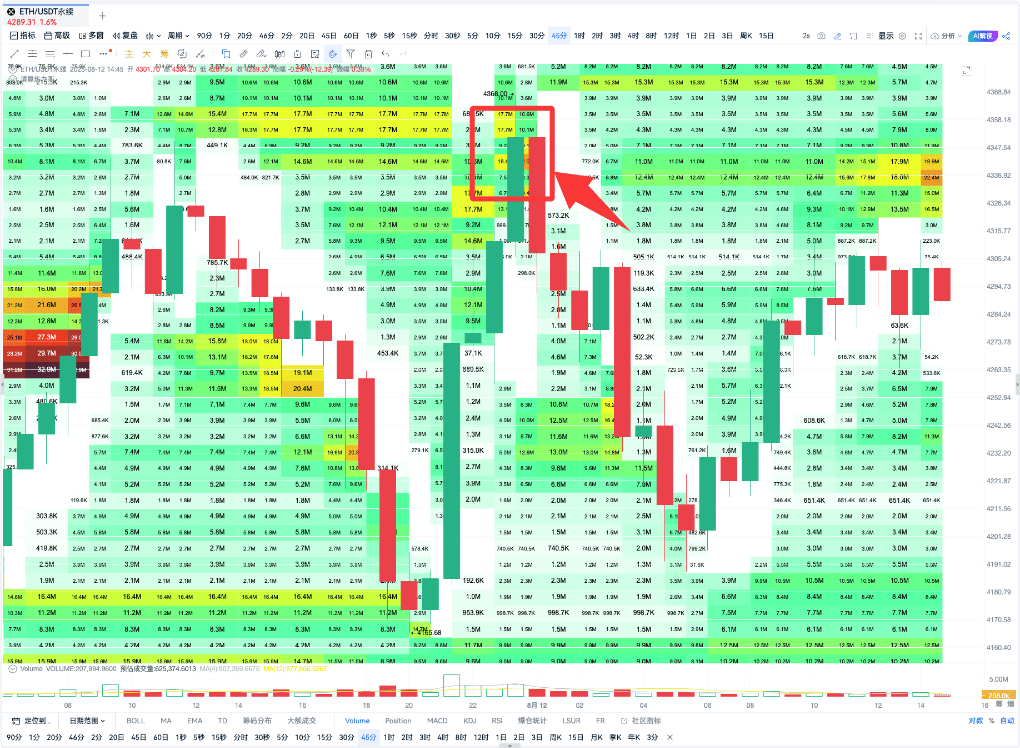
Chart OKX-ETHUSDT perpetual contract 45-minute cycle
The area within the red circle in the chart:
This position is a dark yellow area, resulting in concentrated liquidation, forming high resistance after liquidation, releasing liquidity. Subsequently, the price experienced a slight decline.
Comprehensive use:
● The 'magnetic area' reveals the core of market liquidity, where prices tend to flow and gather towards that area;
● The 'reversal area' helps us anticipate the formation of support and resistance areas, fundamentally understanding the logic of market price fluctuations.
● The combination of the two is a relatively comprehensive liquidation heatmap strategy, providing rich reference for short-term, medium-term, and even capital management.
3. Analyze in conjunction with other indicators
The liquidation heatmap can effectively capture key liquidity dense areas in the market. If combined with other indicators for multidimensional verification, it can enhance the accuracy and operability of strategies.
Large orders from the main force + liquidation heatmap
The flow of large orders from the main force is one of the key driving forces behind market price movements. When the high liquidation area (dark yellow or dark purple area) in the liquidation heatmap aligns with the direction of large orders, the probability advantage of market trends will significantly increase.
1) Large inflow of long orders + magnetic area attraction
If the current large order completes an exceptionally large amount of long orders (e.g., over ten million dollars), and at the same time the liquidation heatmap in the space above the price shows dark areas (such as yellow or purple), it indicates that the bullish main force is likely to have completed its layout, targeting the deep-colored magnetic area above, making the probability of continued price rise very high.
2) Large inflow of short orders + magnetic area attraction
If the current large order completes an exceptionally large amount of short orders (e.g., over ten million dollars), and at the same time the liquidation heatmap in the space below the price shows dark areas (such as yellow or purple), it indicates that the bearish main force is likely to have completed its layout, making the probability of price decline or significant correction very high.
By combining large order transaction data with the liquidation heatmap, investors can more clearly identify the flow of funds at key price levels and formulate precise trading strategies based on the changes in liquidity dense areas.
Combining with other indicators:
Indicators such as MACD, TD series, OBV, etc. also have significant reference value:
● MACD (trend confirmation tool)
In conjunction with the liquidation heatmap, it is suitable for confirming the trend direction after a breakout.
● TD series (turning point capture tool)
In conjunction with the liquidation heatmap, one can enter high selling and low buying trades at reversal points in high liquidation areas.
● OBV (capital flow monitoring tool)
Used in conjunction with the liquidation heatmap to verify the inflow and outflow of funds within the magnetic area, assessing the continuity and strength of the market.
By combining other technical indicators, the liquidation heatmap can more efficiently help traders capture trends and reversal signals, enhancing the overall win rate and execution of trading strategies.
4. Summary
The liquidation heatmap, as an innovative capital flow analysis tool, can accurately identify the liquidity dense areas in the market, providing strong references for capturing key support and resistance prices.
In practical application, by combining information on the flow of large orders, the reliability of the magnetic area can be effectively verified, further improving the win rate of price trend judgments. Additionally, using it in conjunction with traditional technical indicators (such as MACD, TD series, OBV, etc.) can further assist traders in confirming market signals from multiple dimensions, optimizing the comprehensiveness and effectiveness of trading strategies.
Overall, the liquidation heatmap not only provides traders with a unique perspective to understand market sentiment and capital behavior, but also injects new momentum into the scientificity and accuracy of trading decisions. By reasonably interpreting and flexibly using this tool, traders can enhance their win rate in the rapidly changing market and obtain more robust profit opportunities.


