Fundamental situation:
The U.S. and China have again postponed the implementation of a 24% tariff for 90 days, effectively avoiding the trade shocks that a sudden tariff increase could cause, reducing systemic trade risks, and boosting market risk appetite, which is beneficial for BTC, ETH, and high beta altcoins. However, this is merely a short-term window, and the core judgment of future trends still depends on whether both sides can turn negotiations into a long-term agreement and the direction of monetary policy.
Bank of America has issued a warning: Inflation continues to remain above target levels, and coupled with the impact of tariff increases, the basis for the Federal Reserve to cut interest rates in September is not sufficiently strong. According to CME's 'FedWatch', the probability of a 25 basis point rate cut is 85.9%.
CPI data is about to be released, and U.S. stocks may face a dilemma: if the inflation data is too hot, it will reduce the likelihood of the Federal Reserve cutting interest rates in September; if the inflation data is too cold, it will further confirm signs of a slowdown in the U.S. economy. Regardless of the situation, U.S. stocks are likely to experience negative fluctuations after the CPI data is announced.
Technical analysis:
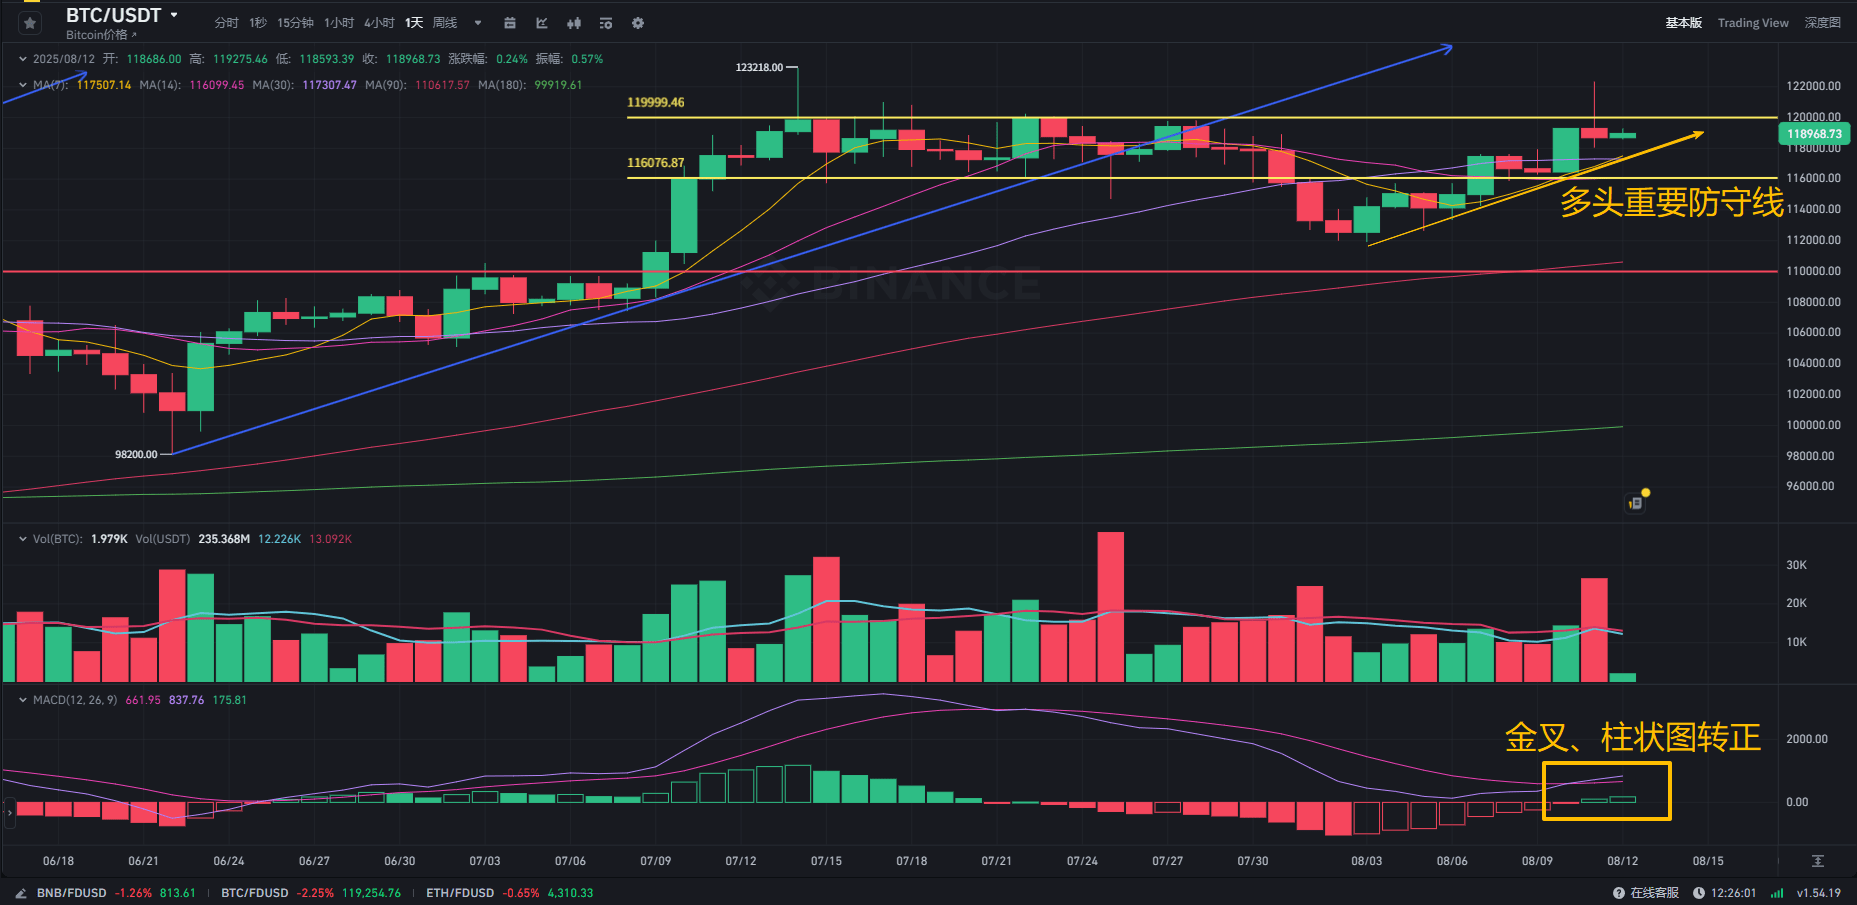
BTC: After a price surge yesterday, it fell back, forming a bearish candle with a long upper shadow, which is a probing breakthrough of the recent market. During the breakthrough, trading volume significantly increased, and during the pullback, energy decreased, indicating that the selling pressure at high levels has not been released on a large scale, which is a common pattern of confirmation or digestion after a breakthrough. The 7-day moving average has turned upward, crossing above the 14-day and 30-day moving averages to form a golden cross, with the short-term central moving averages showing a bullish arrangement. The MACD histogram has turned positive, and the fast and slow lines have formed a golden cross and are diverging upward, indicating that short-term momentum is gradually recovering. If the subsequent market can hold support when pulling back to the 7-day moving average and break through the 120K level with increased volume, there will be an opportunity to create a new historical high and aim for 135K. A platform support was formed around 116K on Saturday, which is an important defensive level for bulls; if it breaks with increased volume, short-term risks will increase, and we can look towards 111K. From the 4-hour chart, after a five-day downward movement to 118K, a slight rebound occurred, with this position serving as the starting point for Sunday’s upward movement, showing significant support. In intra-day operations, focus on the support situation at 118-117K below, and pay attention to the resistance level at 120.5-121.5K above.
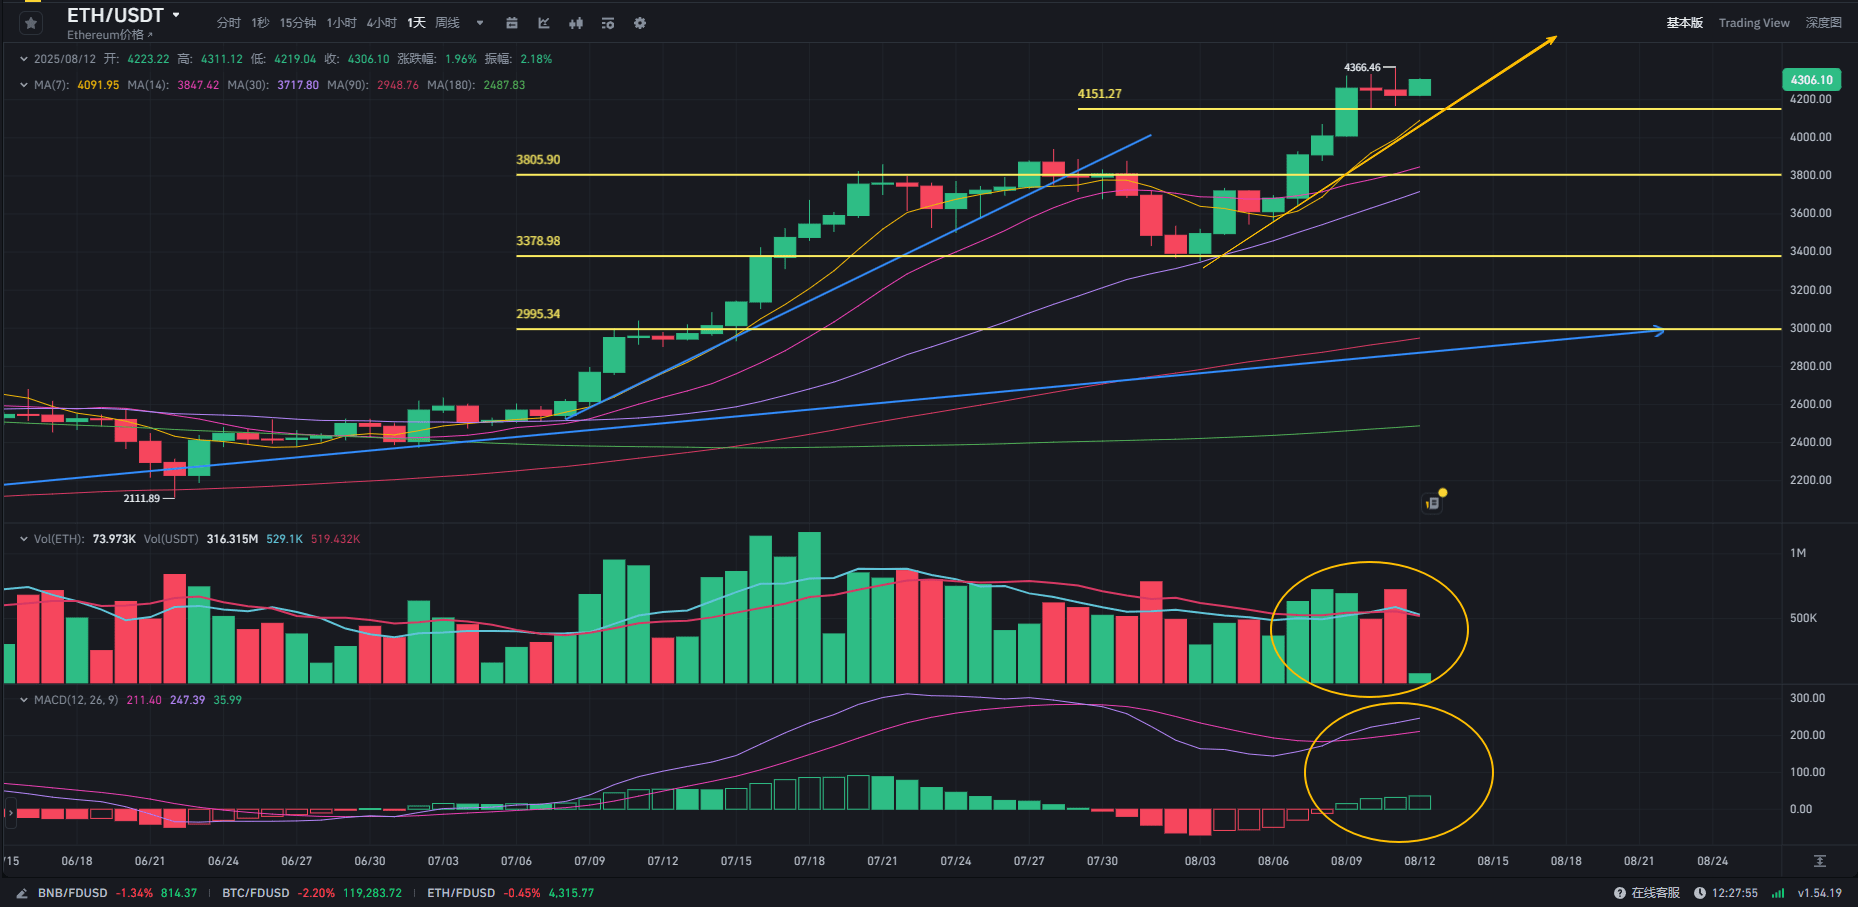
ETH: The daily chart shows that after a short-term strong surge, Ethereum has entered a high-level consolidation phase. A two-day consolidation during the upward process is normal; as long as it does not break below the moving average support, the overall upward channel will not be damaged. The short-term moving averages are arranged in a bullish manner, and the angle of divergence is relatively steep, indicating that the current trend is in an acceleration phase. In terms of trading volume, there is an increase during the upward wave, and there has been no extreme exhaustion of energy when recently reaching highs. The momentum indicator MACD histogram has turned positive and is gradually expanding, with the fast line recovering, indicating that short-term momentum is recovering. For Ethereum at high levels, the increase in the past few months has been significant; even if it is to enter a major decline phase later, it will inevitably experience a long period of horizontal consolidation at high levels before that, so there is no need to worry about a waterfall-like decline for now. From the 4-hour chart, in recent days, a low point has formed around 4150, and the low point that dropped in the early morning has risen, with no signs of a downward trend yet. In intra-day operations, focus on the support range of 4240-4200 below and the resistance range of 4340-4380 above.
Altcoins: As high-risk assets, altcoins have shown a greater retracement during market adjustments. After a high surge and subsequent drop over the weekend, a three-day bearish trend has formed, with an overall decline of more than 10%, especially in the meme sector where the retracement is more pronounced. The mainstream coins have strong attraction for funds, resulting in weaker continuity for altcoins, with funds concentrated in the mainstream coin market, and high beta sectors facing serious capital outflows. Short-term buying confidence in altcoins is compromised, and there are currently no effective signals to stop the decline from a technical perspective. It is advisable to patiently wait for trading opportunities, avoid blindly chasing after mainstream coins, and not rush to bottom fish for altcoins. One can wait for the daily chart of altcoins to show two candles with long lower shadows before considering entering the market. For MEME-type coins, if the rebound in 24 hours is less than 5% and the trading volume is insufficient, continue to remain on the sidelines. In the future, pay close attention to opportunities for certain altcoin sectors to show unusual volume when mainstream coin gains slow down and trading volume declines, prioritizing medium market cap altcoins that have had recent on-chain hotspots.
Cryptocurrency market volatility is severe; caution is required when entering the market. The above is only a personal opinion and does not constitute investment advice, only for reference and sharing.
