

The native token of Hedera Hashgraph, HBAR, has remained stable over the past four days, diverging from the recent gains of the broader crypto market.
While the overall market has risen in the last 24 hours, HBAR has gone against the trend, recording a decrease of 2%. This highlights the growing bearish sentiment as the token risks breaking below its current narrow trading range.
HBAR faces increasing downside risk
The constant outflow of capital from HBAR's spot market has heavily weighed on its price action. According to Coinglass, the spot outflows of HBAR totaled $6.42 million in the last three days, showing the growing bearish bias against the altcoin.
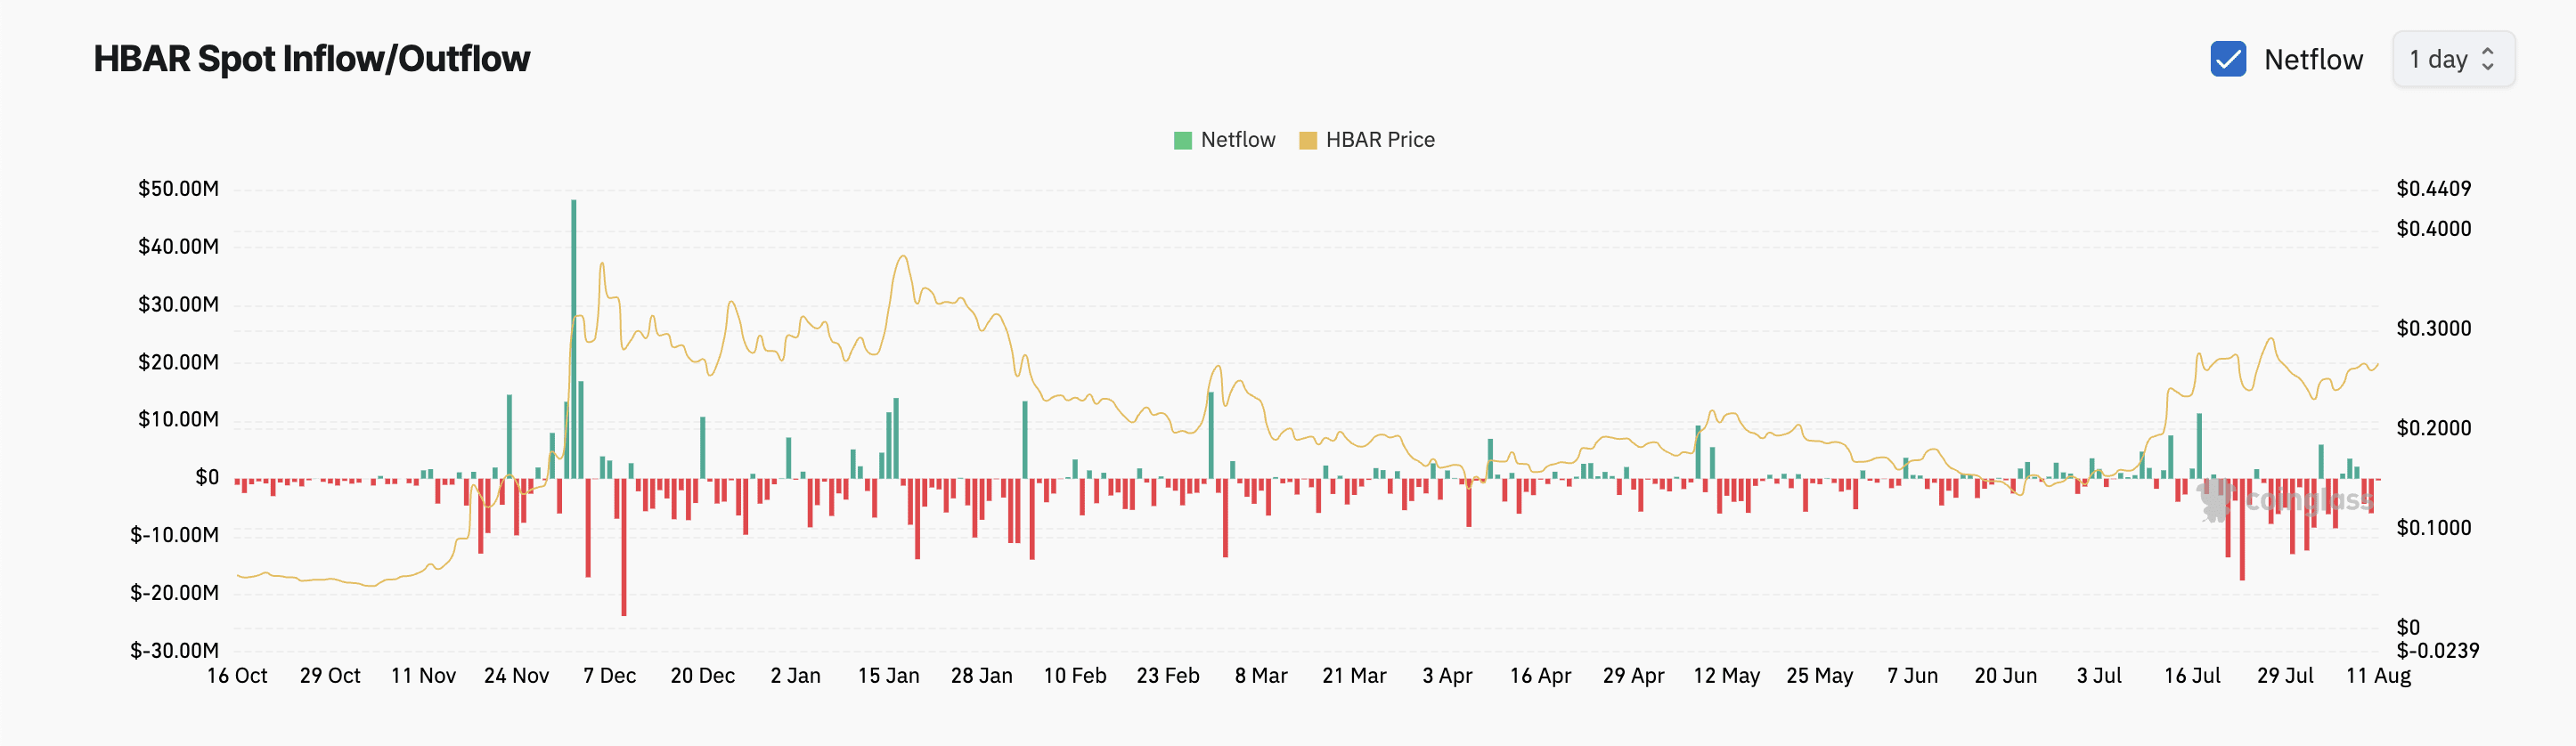 HBAR Spot Entry/Exit. Source: Coinglass
These outflows occur when investors of an asset withdraw their capital from the spot markets, usually selling their coins and moving funds elsewhere. This signals a weakening demand for the asset and is a trend known to lead to lower asset prices.
The daily outflows from HBAR's spot markets over the past three days confirm the growing uncertainty around the token, which has kept its price stable. This pattern also reflects a gradual shift in market sentiment as traders increasingly seek to exit their positions.
Moreover, the negative readings of the Chaikin Money Flow (CMF) for HBAR on the daily chart confirm its difficulty in attracting buying interest. At the time of this analysis, the momentum indicator is at -0.07 and continues the downward trend.
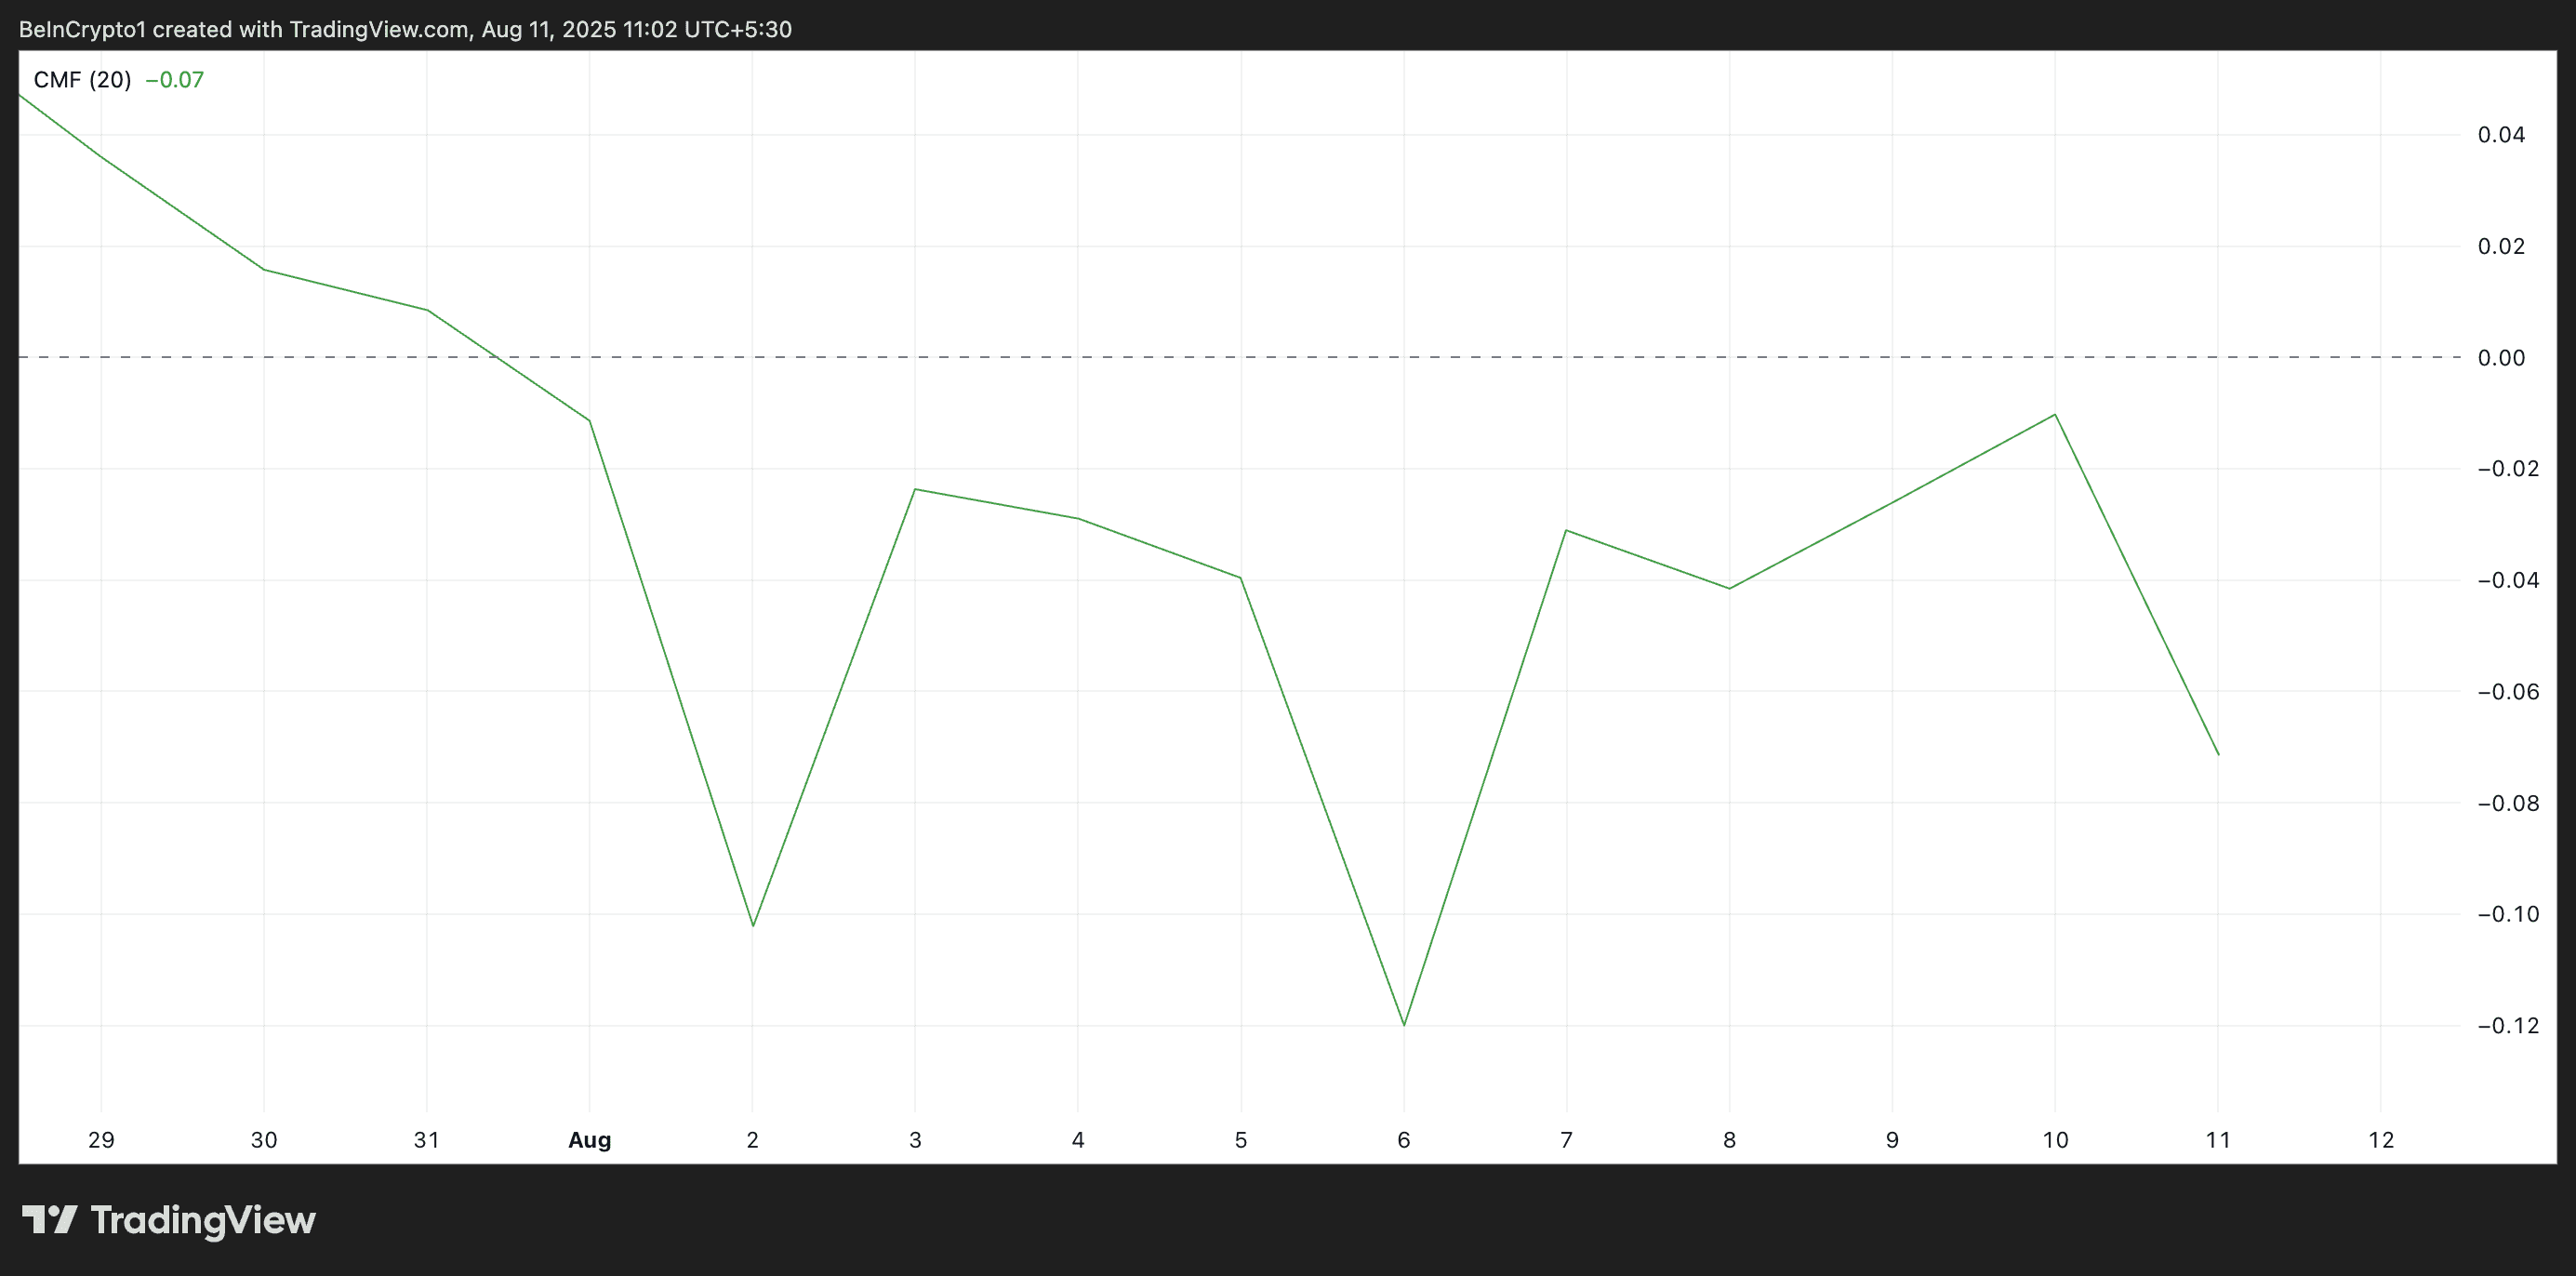 HBAR CMF. Source: TradingView
The CMF measures the buying and selling pressure of an asset over a specified period by analyzing price and volume data. It helps identify whether money is flowing into or out of the asset.
When the CMF is positive, buying pressure is strong, with more money flowing into the asset. Conversely, when its value is negative, selling pressure dominates.
For HBAR, its negative CMF means that more money is leaving the asset as traders exit their positions. This exacerbates the bearish pressure on its price and may trigger a break below the lower line of its current range.
Bears observe support at $0.2591 and below
At the time of this report, HBAR is trading at $0.2663, remaining below the upper line of the horizontal channel, which forms resistance at $0.2667.
With increasing selling pressure, HBAR risks falling towards the support of $0.2591.
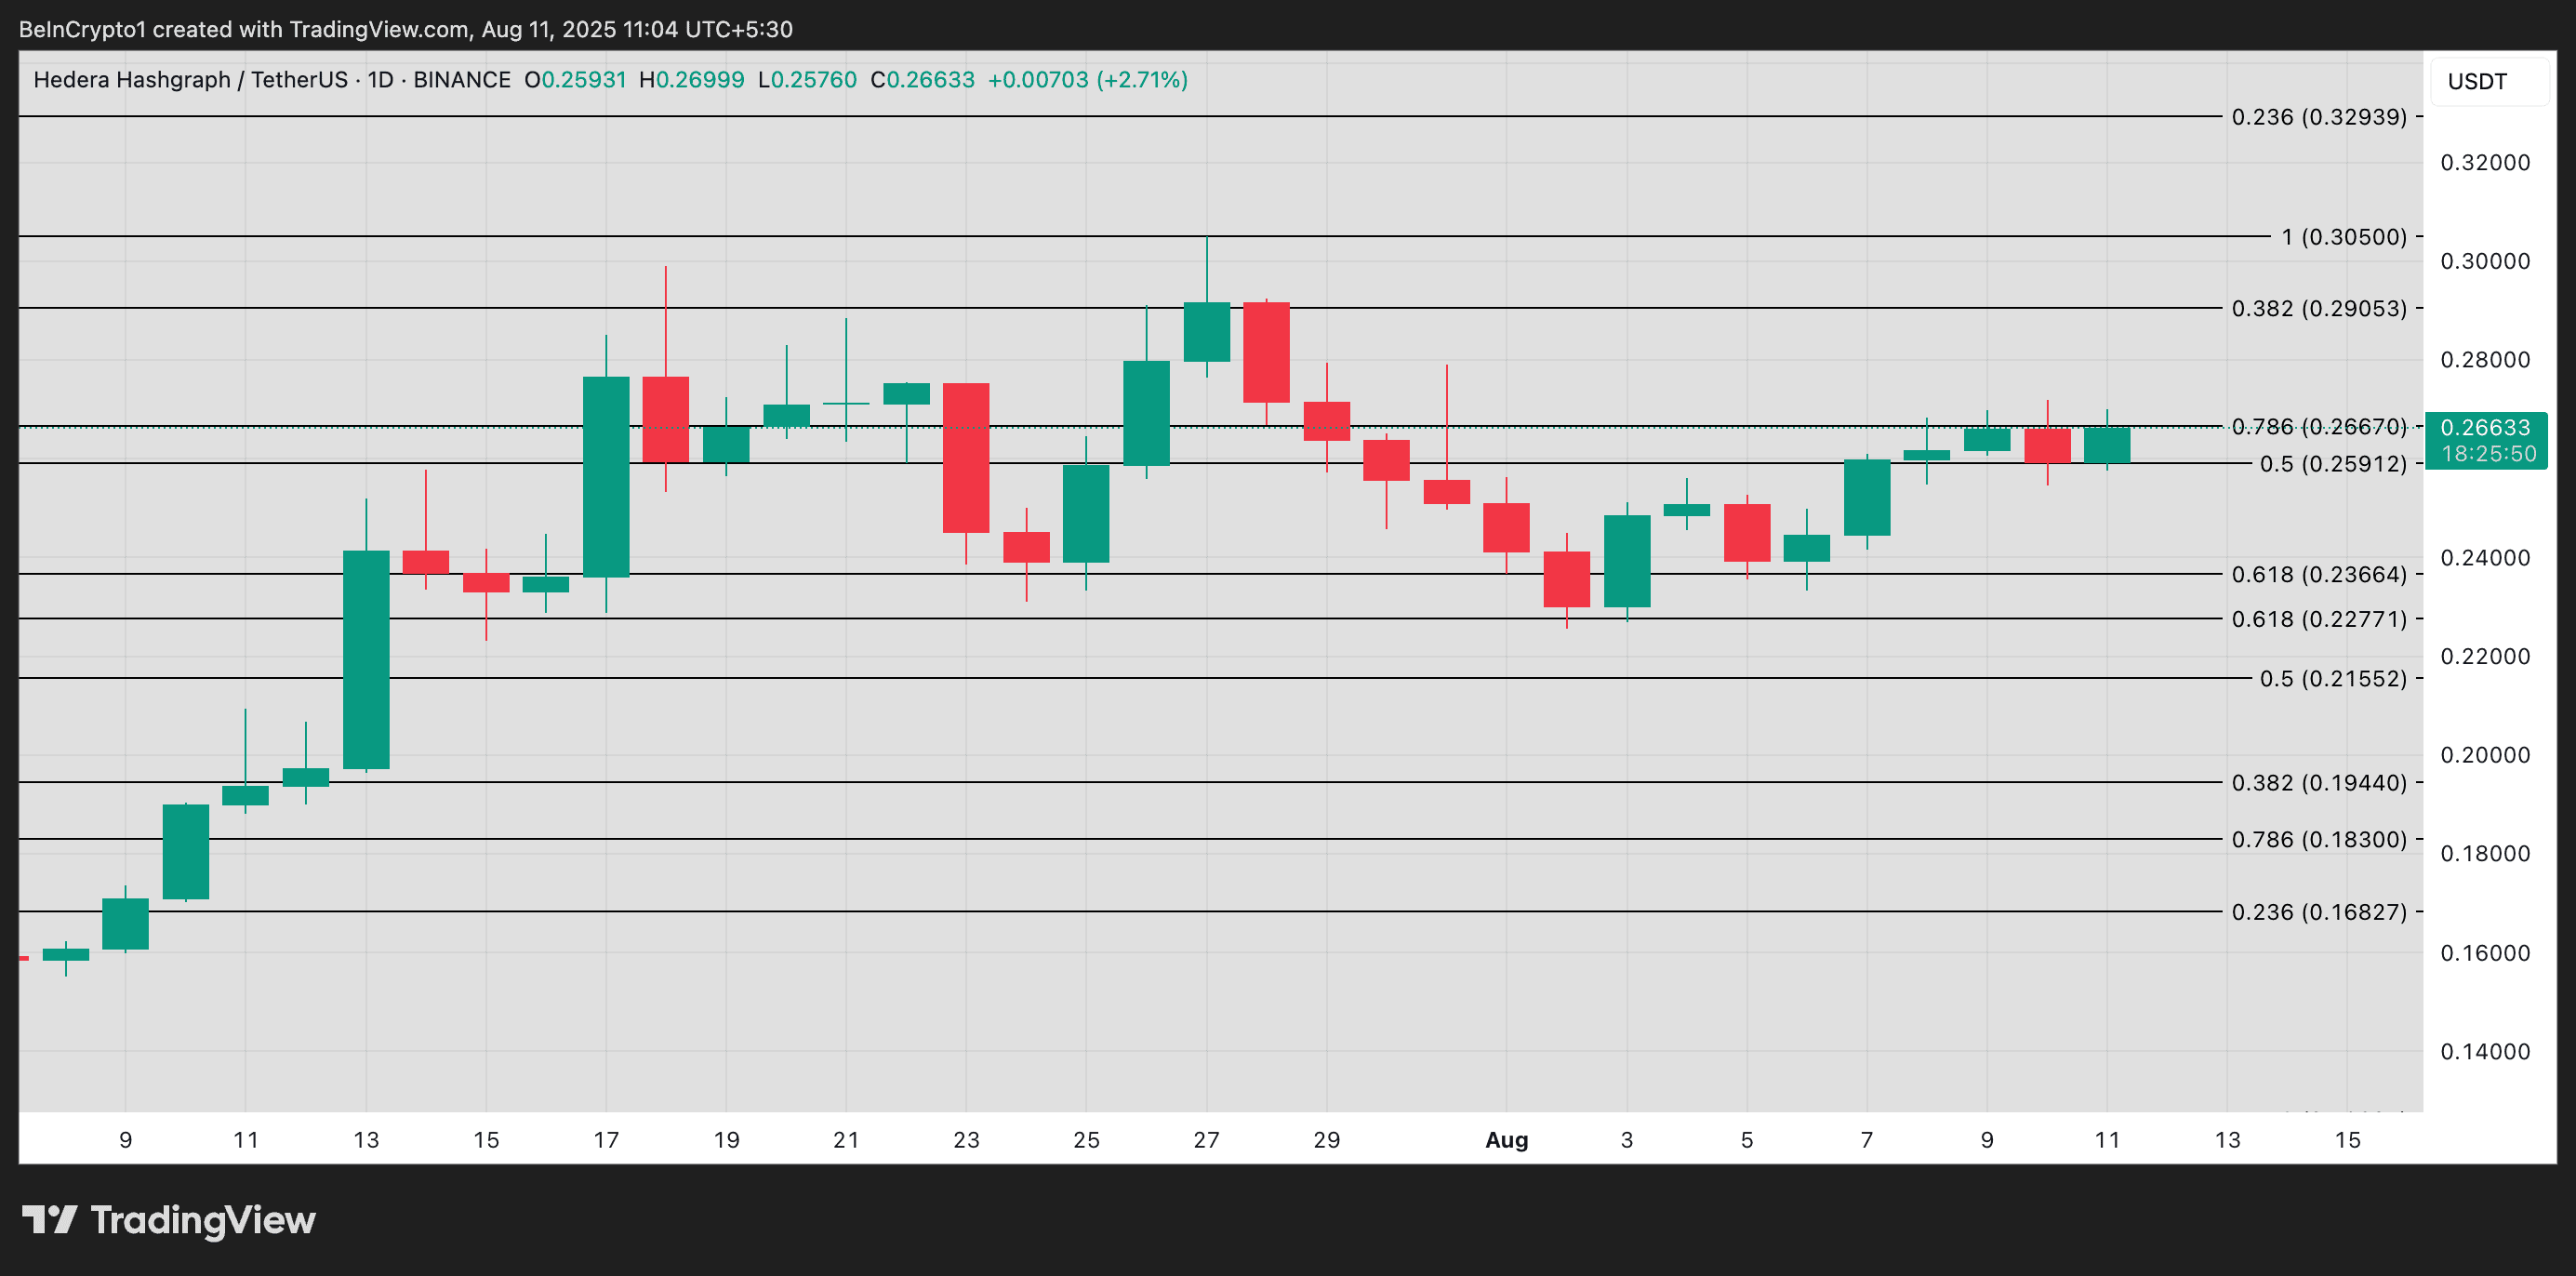 HBAR Price Analysis. Source: TradingView
However, if buyers regain control, they may push the token's value beyond the resistance barrier and towards $0.2905.
The article 'HBAR struggles to stay afloat amid rising capital outflows' was first seen on BeInCrypto Brazil.


