Bitcoin has finally ended its consolidation, continuing to rise after breaking through the bullish flag, with the current price stabilizing around 122,000 USD, just a step away from the historical high of 123,200 USD. After nearly four weeks of sideways consolidation, the bulls have officially launched an offensive, and a new round of price discovery may be about to begin.
4-hour chart: strong breakout but short-term momentum needs attention
From the 4-hour chart, Bitcoin's breakout from the bullish flag is very strong, with prices advancing completely according to bullish expectations.
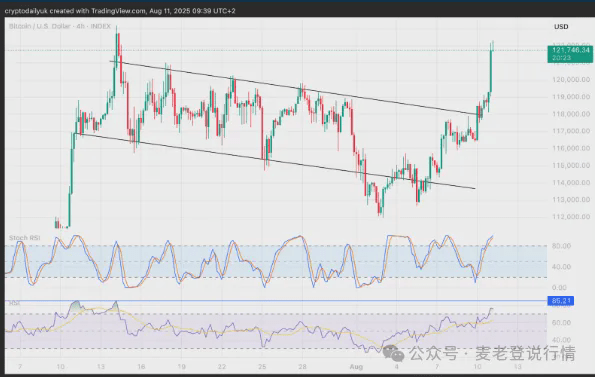
However, chart indicators show that short-term momentum is slightly under pressure - although the stochastic RSI indicator has not completely weakened, caution should be taken regarding whether the previous rebound from the low can continue; the RSI indicator needs to break through the previous high of 85.21 to avoid bearish divergence and safeguard the short-term upward trend.
Daily chart: RSI indicates the upward trend is not over
At the daily level, the RSI indicator has released a clear bullish signal. Looking back at historical trends, in the previous two bullish flag consolidations, the RSI lows synchronized with the price lows, and after breaking through the downward trend line, the price immediately started to rise.
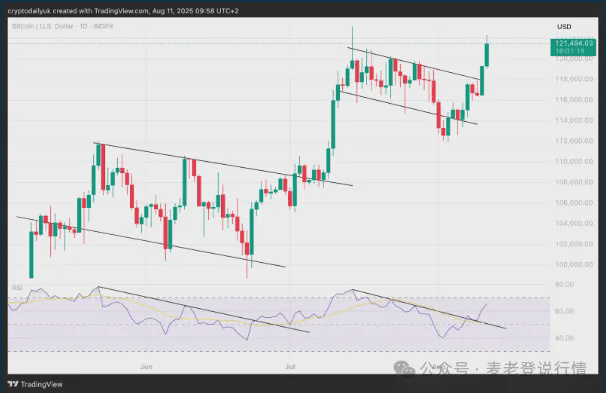
The current trend completely replicates this pattern: the RSI indicator has broken through the consolidation range along with the price and is gradually approaching the overbought zone, indicating that there is still room for further upward movement.
Weekly chart: Inverse head and shoulders pattern pointing to 150,000 USD
The weekly chart shows a more pronounced long-term bullish pattern - after breaking through the neckline of the inverse head and shoulders pattern and confirming with a pullback, the upward trend is currently ongoing. According to this pattern, the theoretical target points exactly to 150,000 USD.
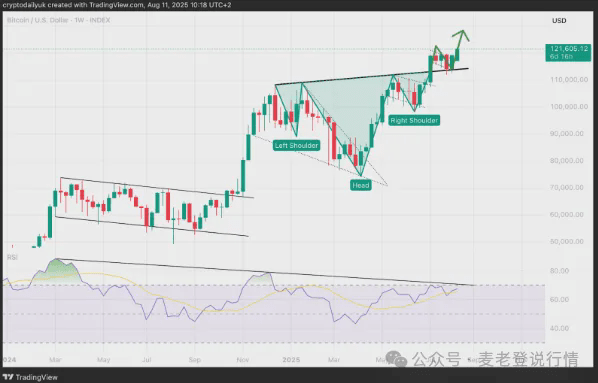
In addition, the weekly RSI indicator is pushing upwards against the downward trend line. If it successfully breaks through the previous high of 88.40, it will completely open up upward space and avoid the risk of bearish divergence.
Key target: Is 130,000 just a halfway point?
In the short term, after breaking through
the historical high of 123,200 USD, 130,000 USD is highly likely to become the next important stop; in the long term, attention should be paid to whether the weekly pattern can meet expectations and advance towards 150,000
USD. However, it should be noted that if short-term indicators show divergence signals, it may trigger a slight pullback. Investors should closely track the RSI breakout situation and whether the historical high can be sustained.
Overall, after Bitcoin broke through the consolidation range, bullish momentum has been fully activated. Whether the subsequent upward trend can continue depends crucially on whether technical indicators can exert force in sync.