

The price of Bitcoin is at $118,573 on August 10, 2025, with a market capitalization of $2.35 trillion and a 24-hour trading volume of $31.06 billion. The intraday price range spans from $116,494 to $118,639, reflecting a tight consolidation as traders await a potential breakout or pullback.
Bitcoin
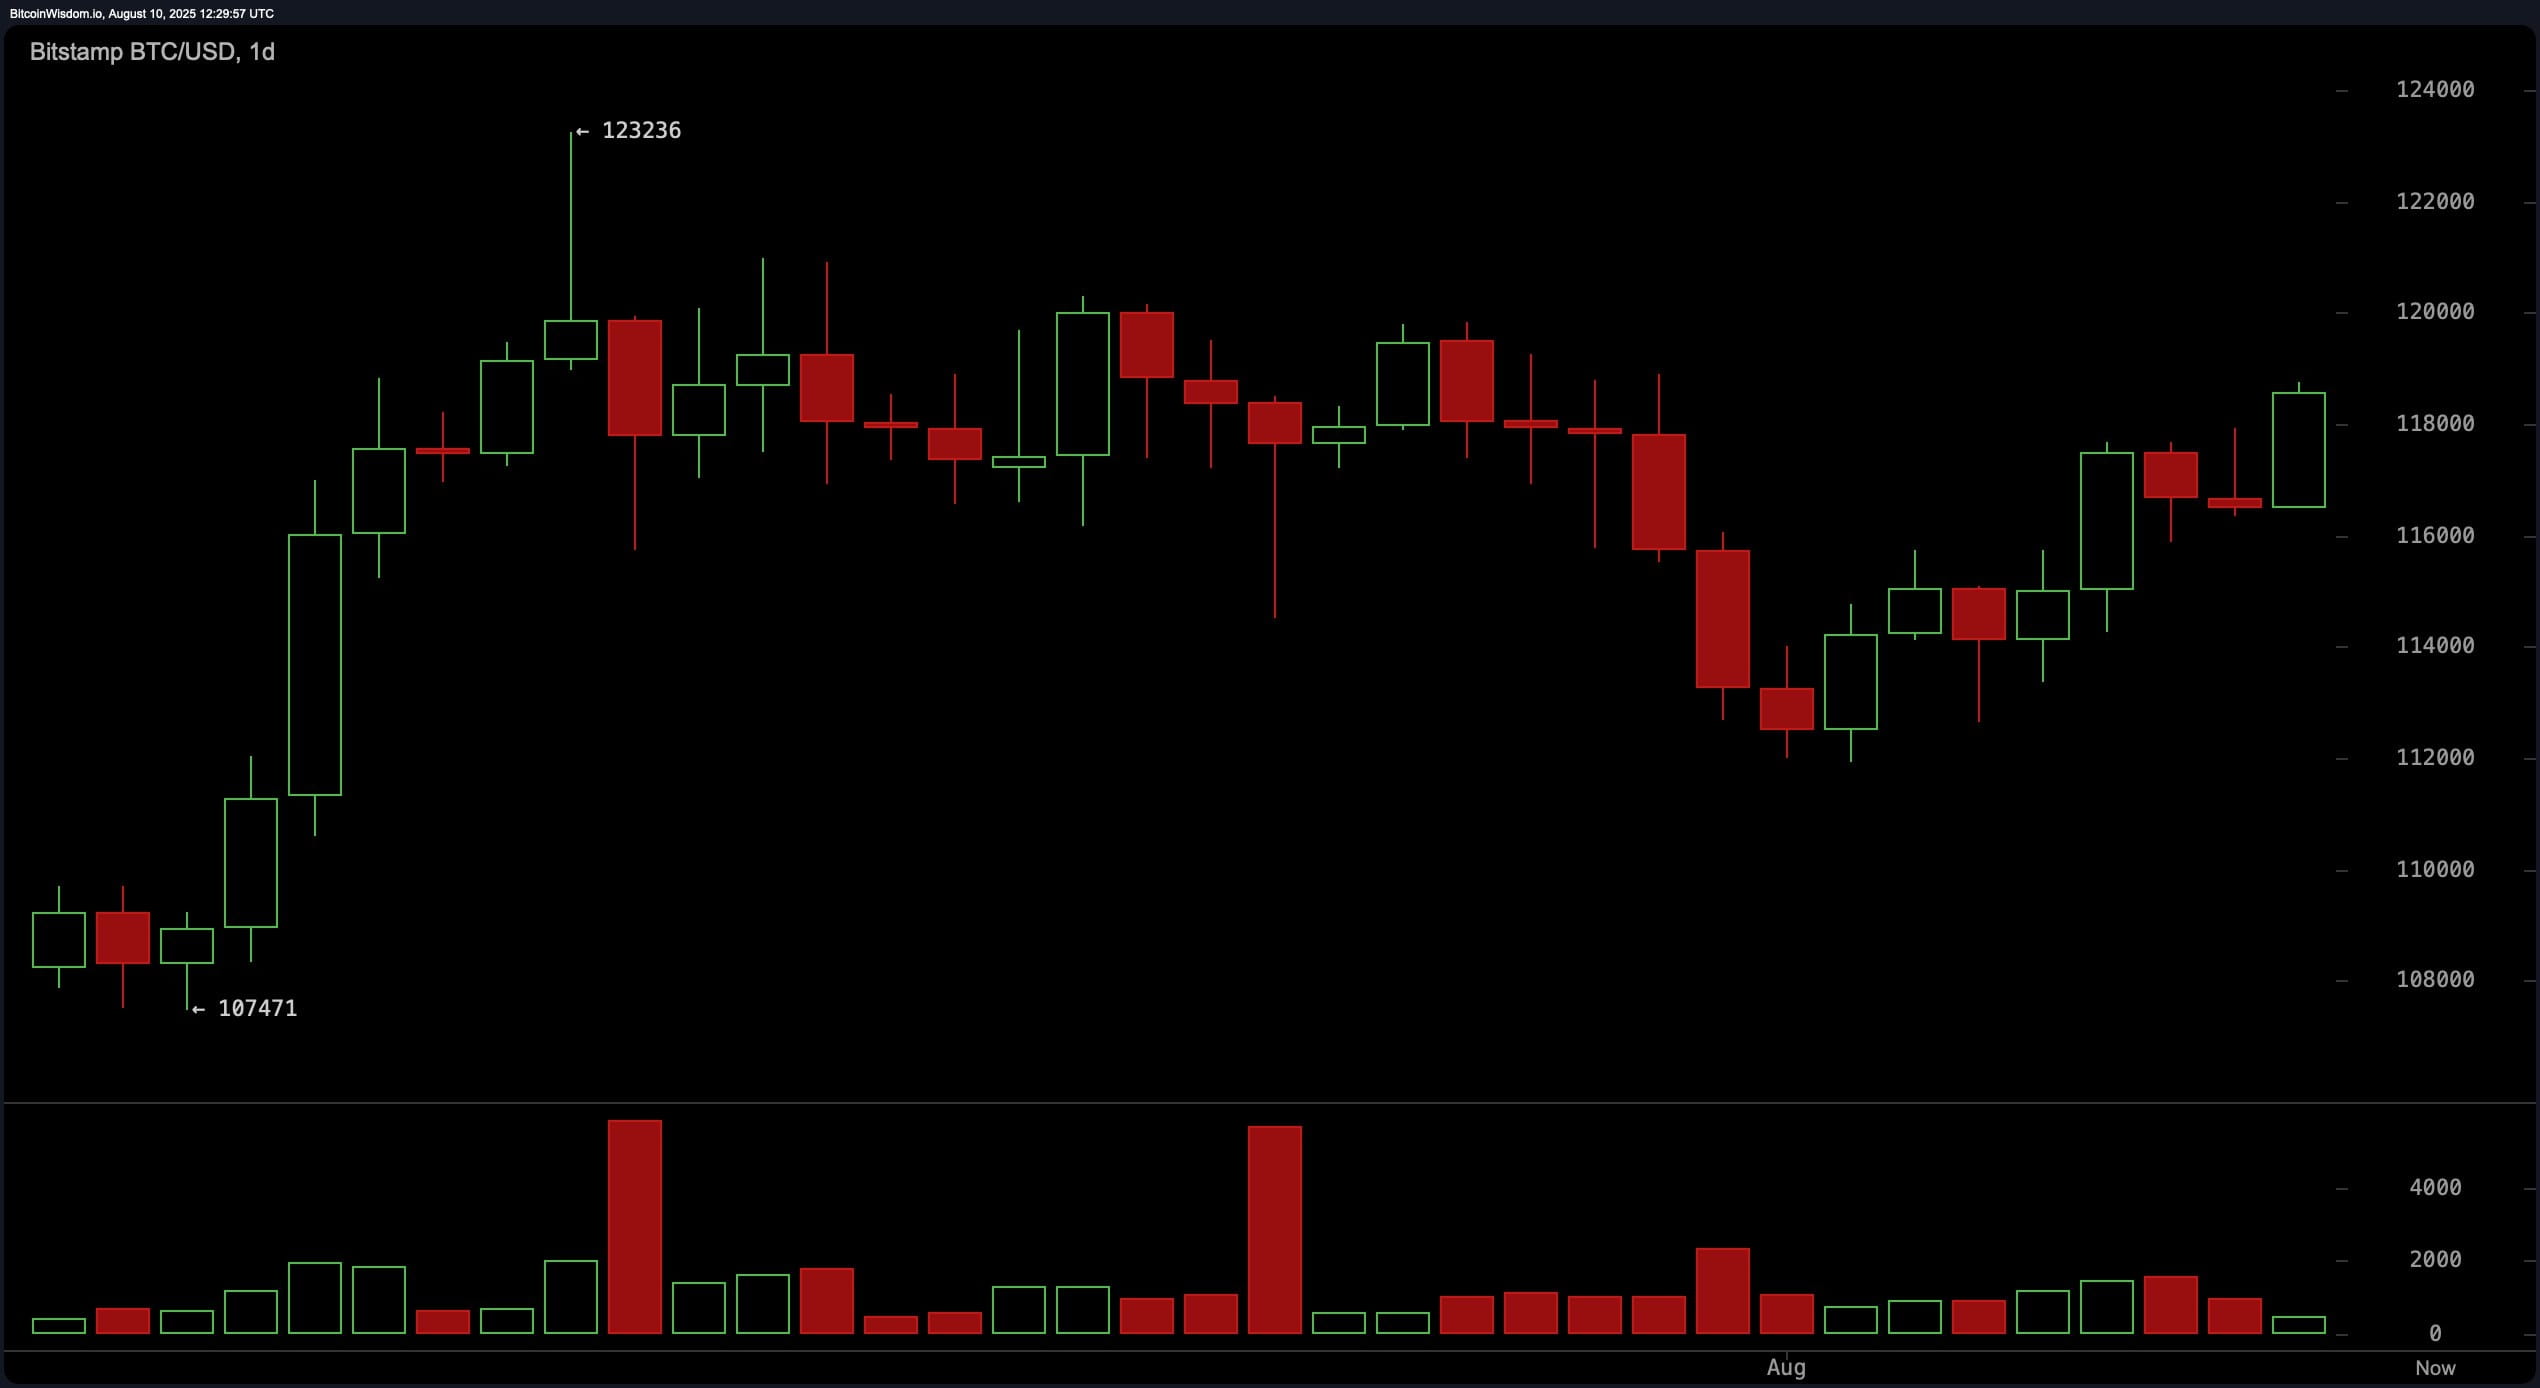
The daily chart shows bitcoin recovering from a strong pullback, bouncing from around $112,000 to the current level. The broader trend remains a mid-range consolidation between the support area at $112,000 and the resistance area at $123,000. The relative strength index (RSI) at 59, the Stochastic index at 68, and the commodity channel index (CCI) at 56 all indicate a neutral momentum phase, while the momentum at 2,855 suggests hidden buying interest. The moving average convergence divergence (MACD) at 528 reflects a sell signal, indicating that despite the recovery, caution is still warranted in the market.
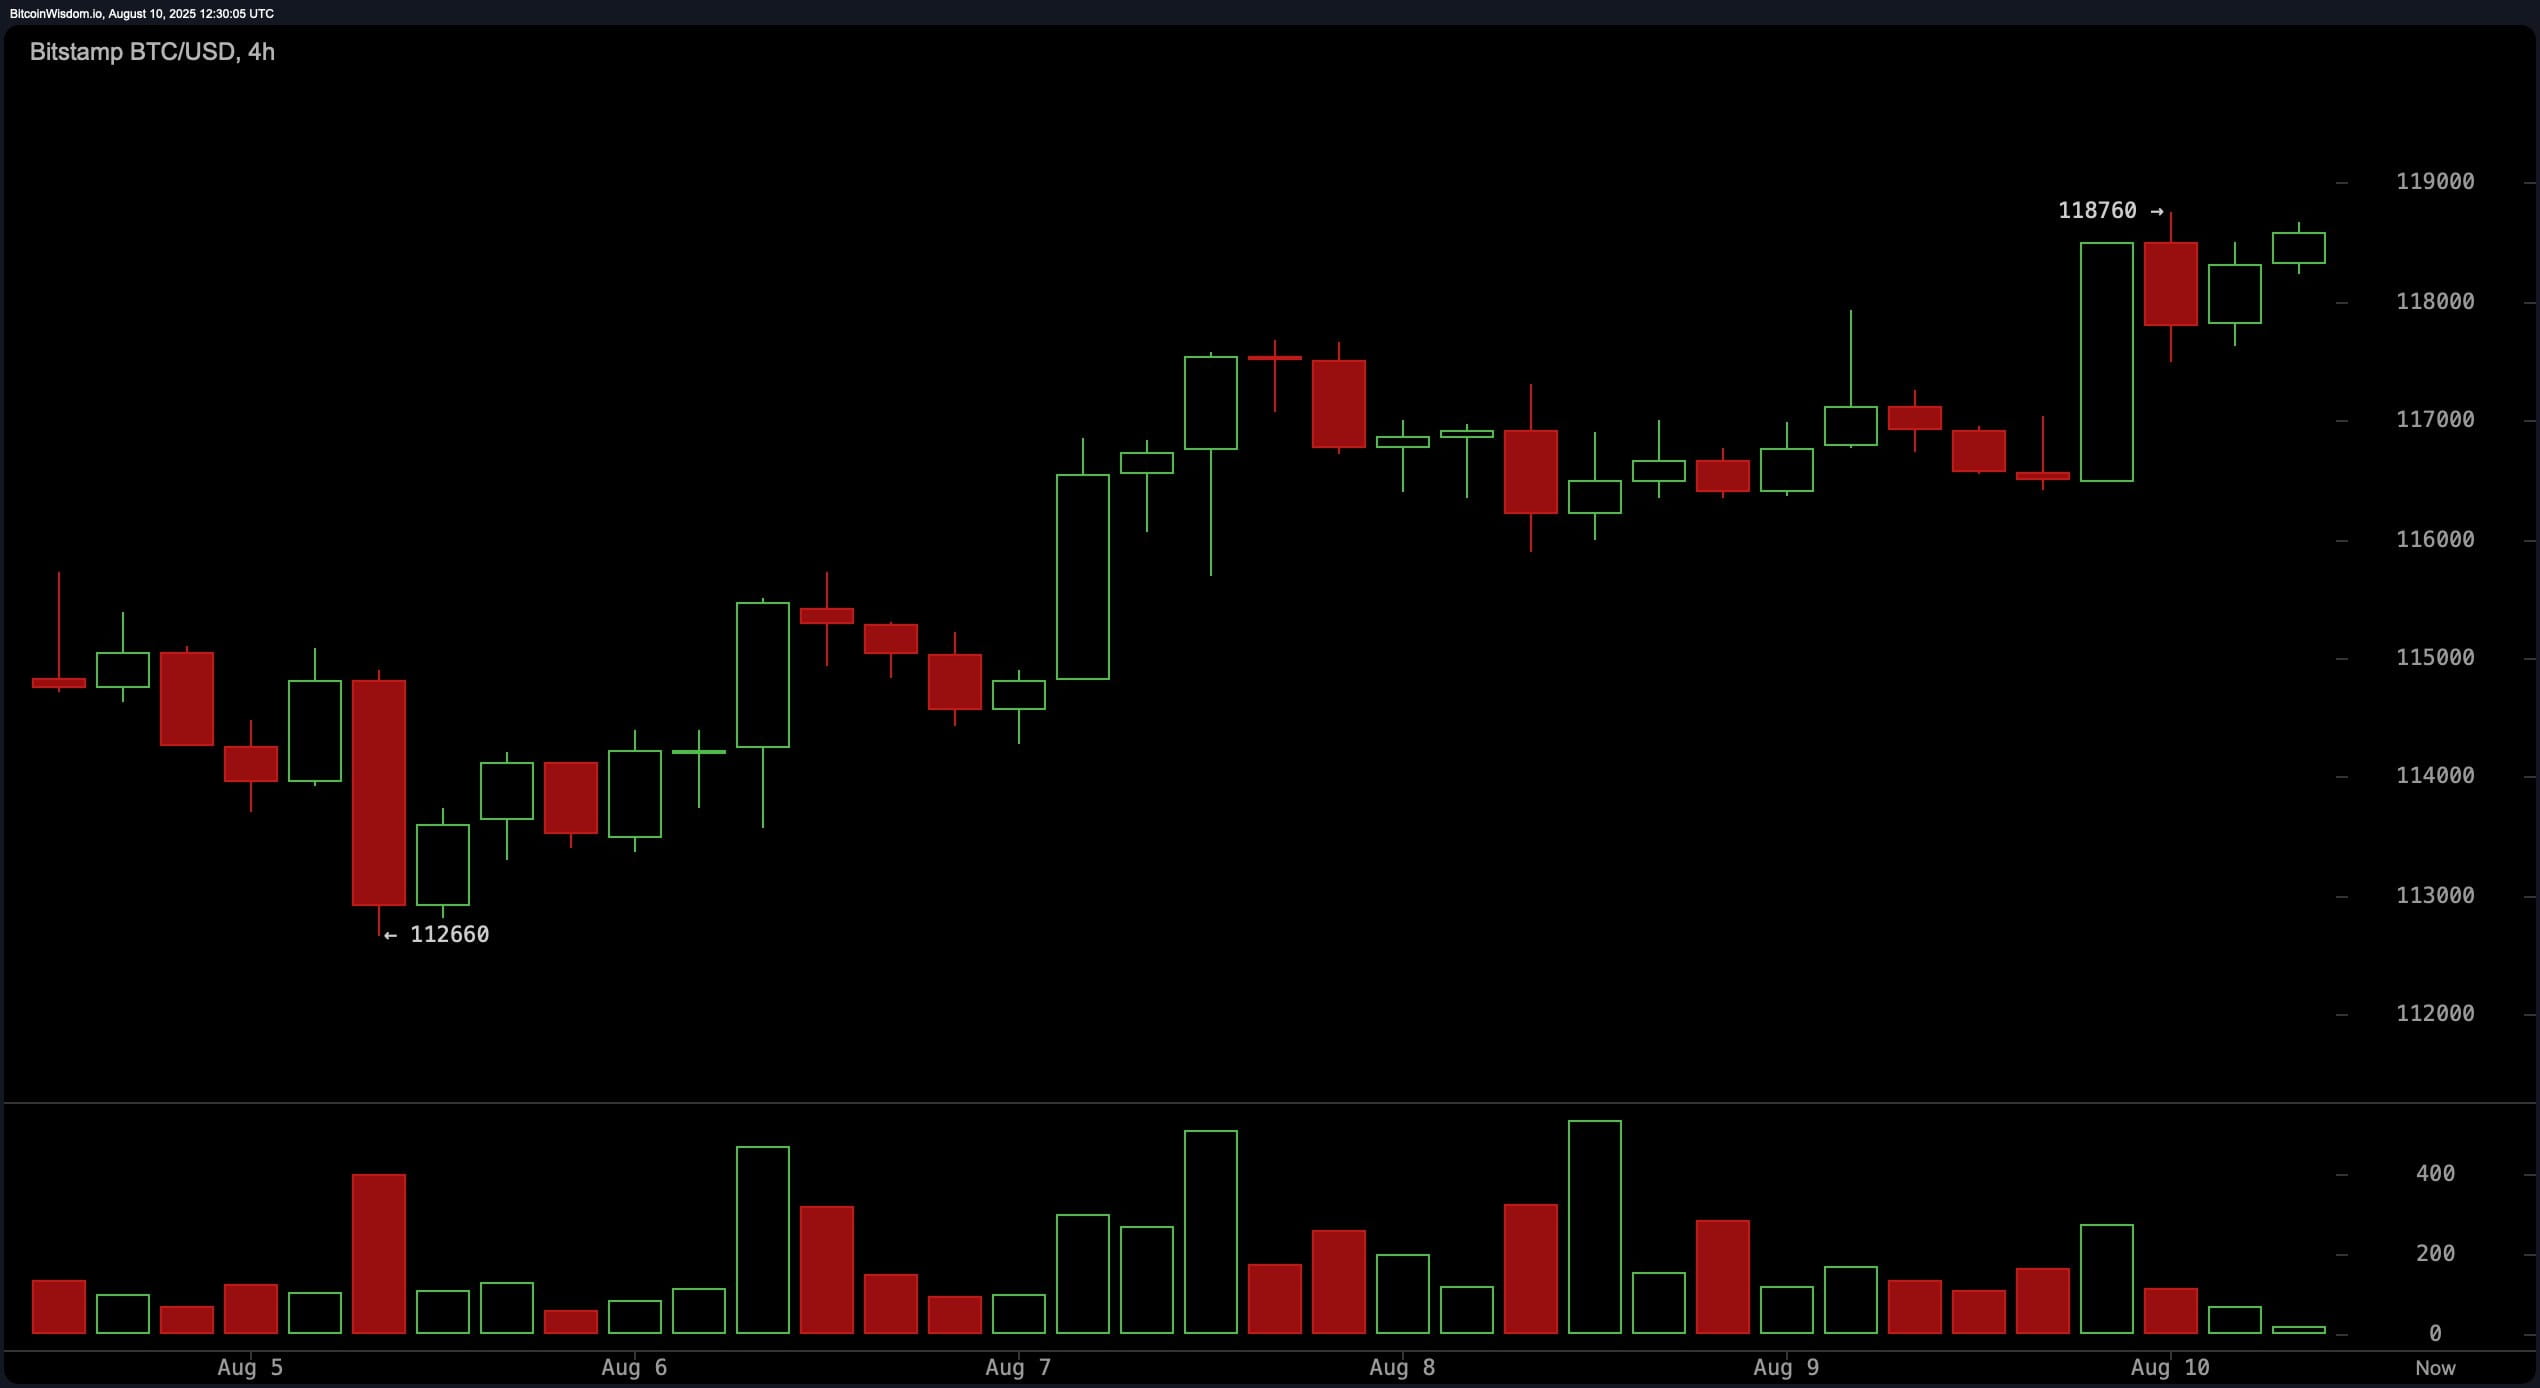
On the 4-hour chart, bitcoin has formed a series of higher highs and higher lows since reaching $112,660, with the latest spike pushing the price up to $118,760. This progress is accompanied by strong volume increases, suggesting strong buying interest, although the short-term resistance at $119,000 remains a significant barrier. The average directional index (ADX) at 16 reinforces the idea that the prevailing trend strength is relatively weak, indicating the potential for either a breakout or a pullback. Traders may look for buying opportunities when prices dip around $117,000, with a cautious approach to taking profits near $119,000 unless volume confirms a breakout.
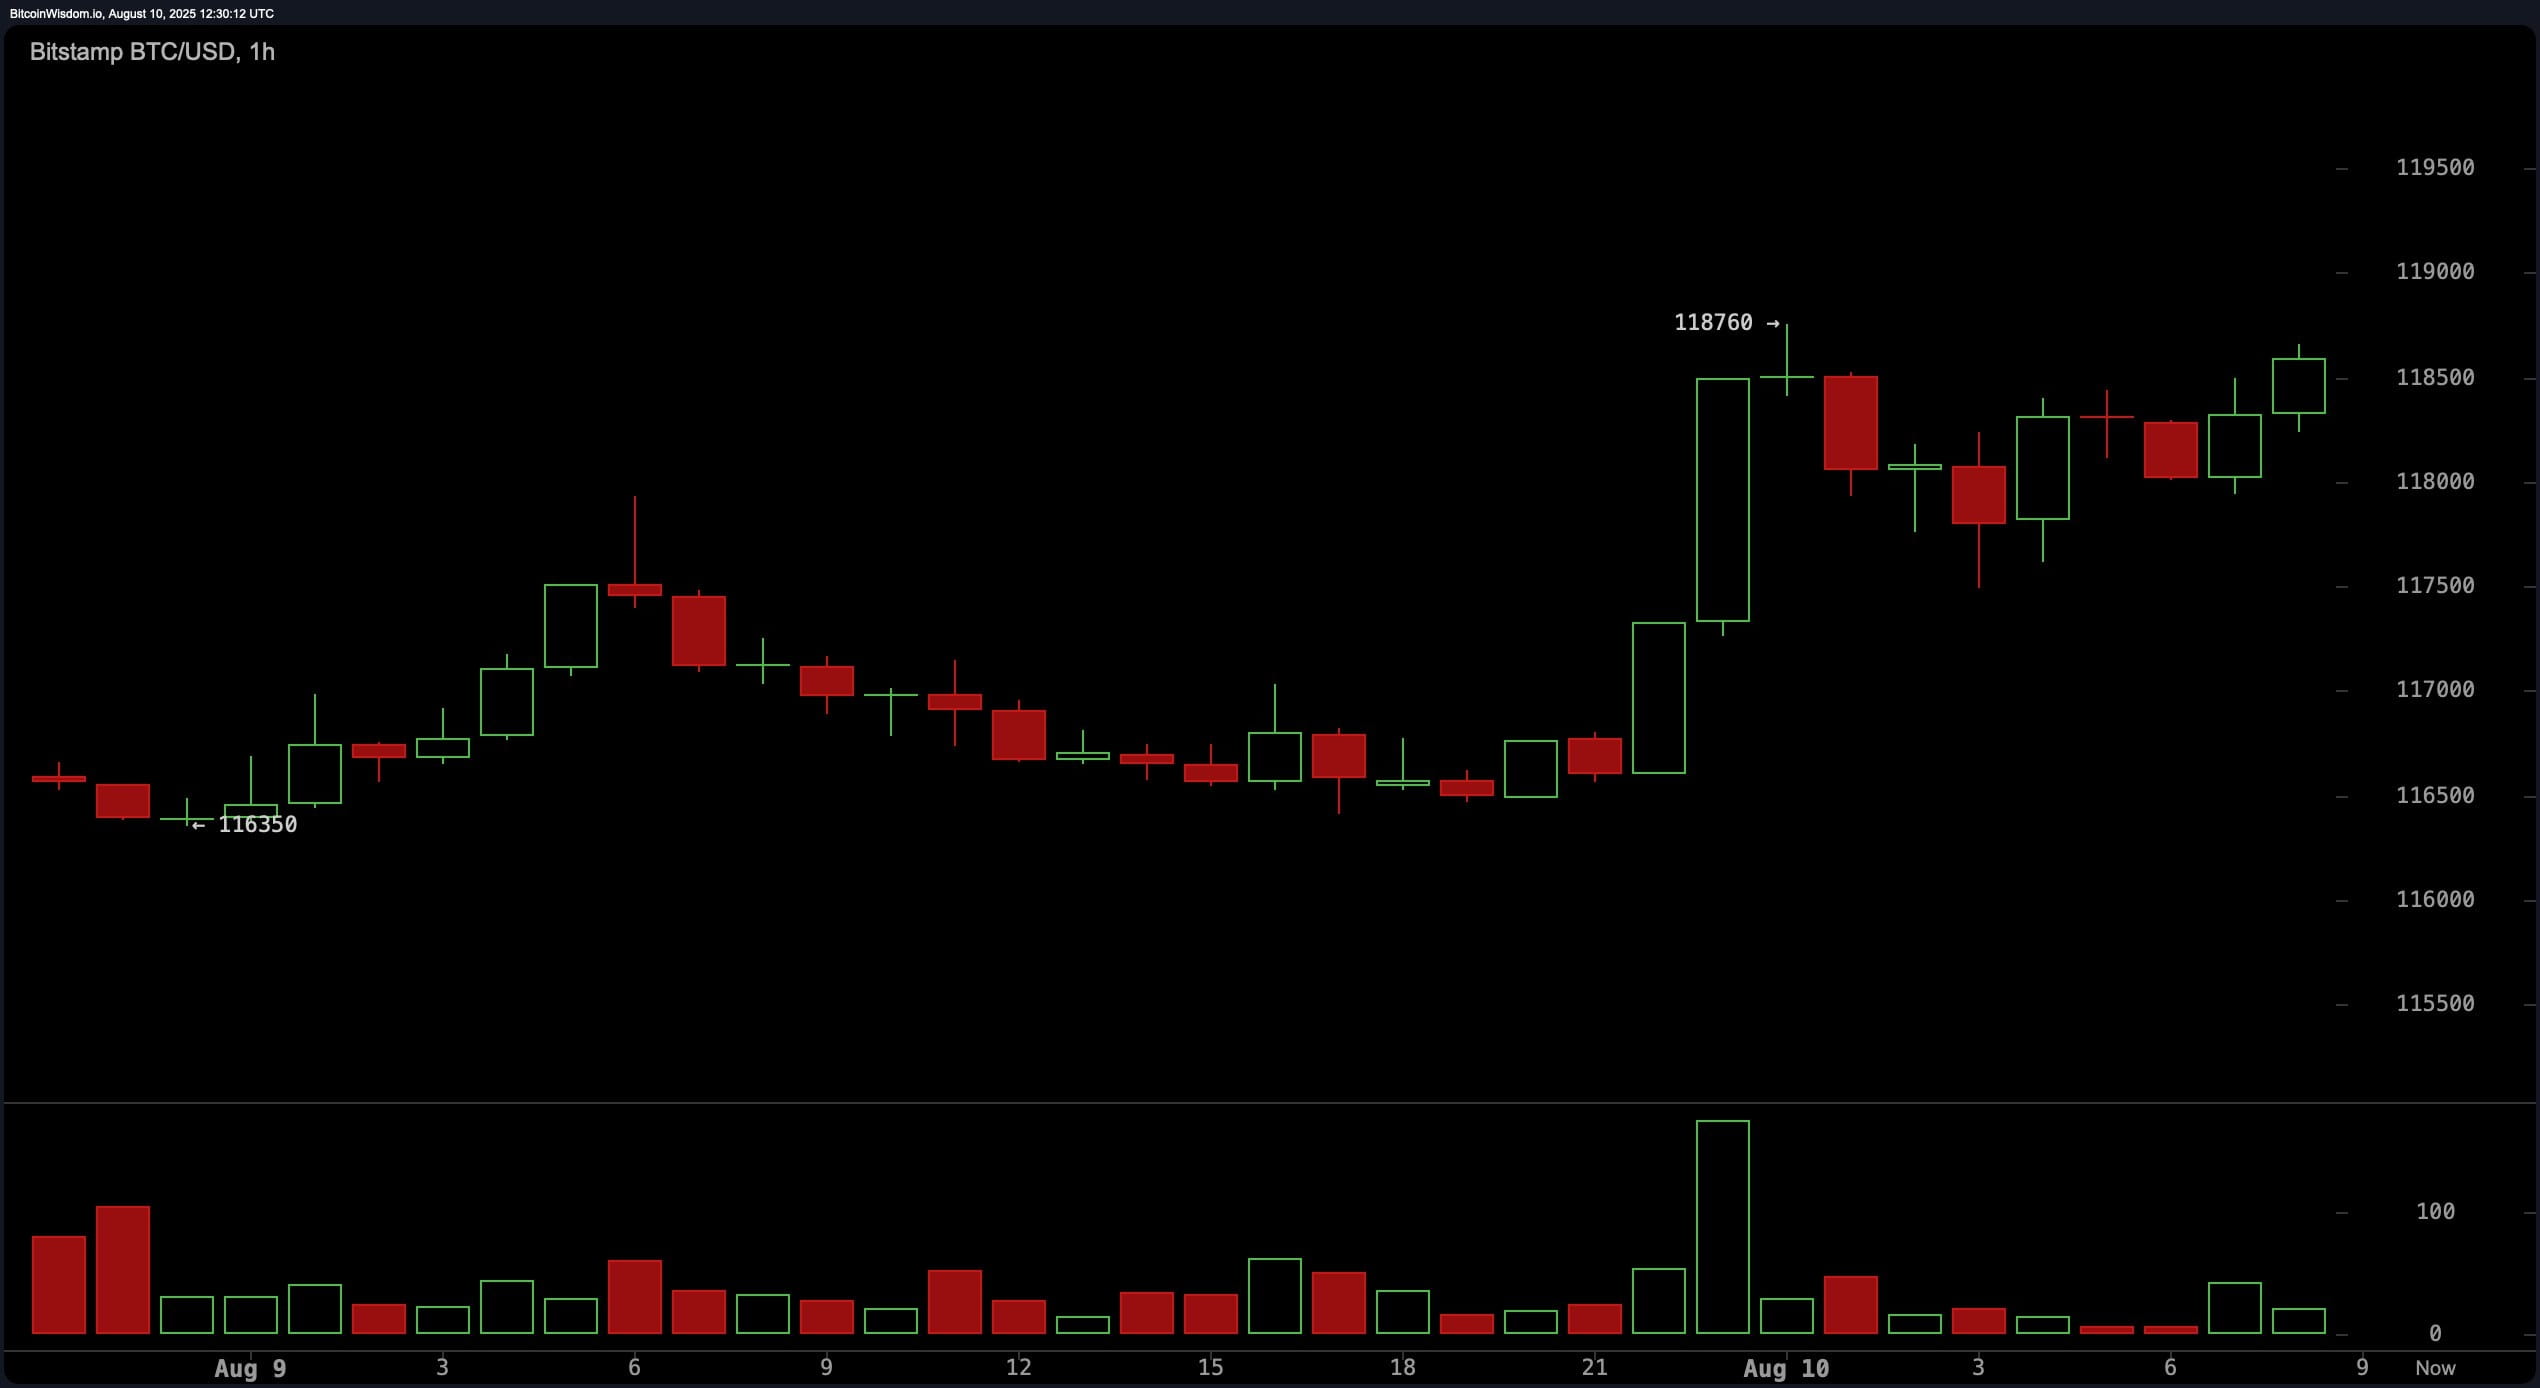
The 1-hour chart of bitcoin shows a strong breakout from $116,350 to $118,760, followed by sideways price action forming a flag pattern. This setup is often followed by continuation if accompanied by increased buying volume. However, the awesome oscillator at -237 remains neutral, and momentum declining after the breakout suggests that consolidation is still ongoing. A decisive push above $118,800 with strong green volume could trigger short-term scalps, while weak breakouts risk pulling back to $117,000.
From the perspective of moving averages (MAs), the technical structure remains overwhelmingly bullish. All key exponential moving averages (EMAs) and simple moving averages (SMAs) from the 10 to 200 periods — including EMA (10) at $116,458, SMA (20) at $116,765, EMA (50) at $113,759, and SMA (200) at $99,740 — are all emitting positive signals. This alignment suggests that while short-term price fluctuations present a mixed to neutral picture, the long-term underlying trend remains bullish.
Overall, bitcoin's price action suggests a potential bullish bias but with resistance limiting immediate gains. The market remains locked in a range from $112,000 to $123,000, with short-term momentum dependent on the $119,000 level. A breakout supported by volume above this point could pave the way for a retest of $123,000, while failure to hold above $117,000 could invite a deeper pullback to the $116,000 support area. Traders seem poised for a decisive move, but the next wave of volume may determine the legitimacy of the breakout.
Bullish Verdict:
The strong correlation of bitcoin with all exponential moving averages (EMAs) and simple moving averages (SMAs) in the buy zone, combined with the formation of higher highs and higher lows on the 4-hour chart, supports the potential breakout up to $123,000 if the resistance at $119,000 is surpassed with strong volume.
Bearish Verdict:
The presence of sell signals on the MACD indicator and neutral indicators across most oscillators, combined with declining volume after the latest breakout, makes bitcoin susceptible to a pullback to the $116,000–$117,000 level if resistance holds.

