On 25/08/10, BTC's bullish flag officially broke through, and Ethereum strongly broke through 4100. The bull market is accelerating.
The big cake weekly line is about to close. Currently, it seems that there is a chance to break the previous high or even exceed it with a bearish engulfing candle next week. The weekly MACD continues to turn upwards with volume not increasing. The daily line has broken through the bullish flag pattern, with the price reaching 118798 and standing above MA20. The MACD should pay attention to the potential crossover of the fast and slow lines crossing the zero axis next week. The next resistance points are at 121000 and the previous high.
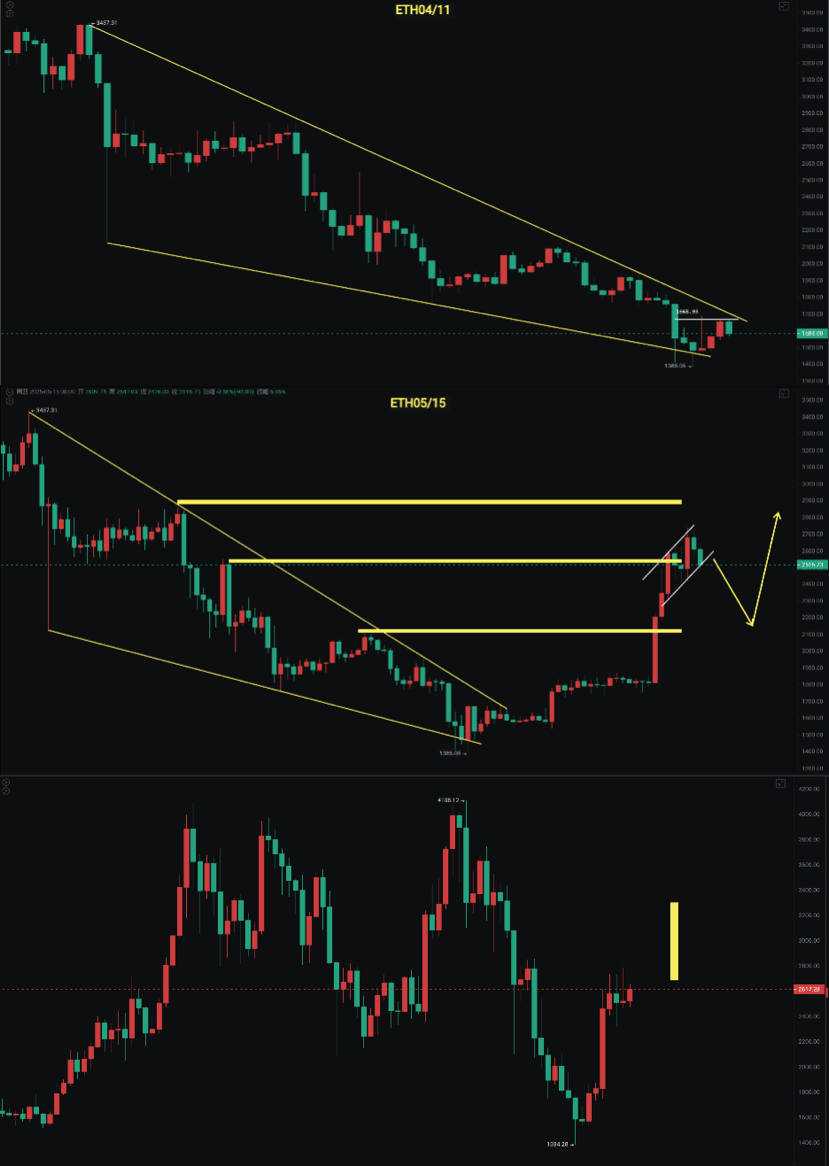
Ethereum broke through 4100 yesterday, and today closed as a doji star, reaching a maximum of 4332. The daily Bollinger Bands are opening. As long as it does not fall back below 3950, it remains bullish. Ethereum's MACD has already crossed the zero axis with the fast and slow lines intersecting. Pay attention to the weekly line's close tomorrow morning. The large triangle pattern on the weekly line, if broken, is considered the starting point of a third wave, targeting an increase to 6700, but the recent resistance point is at 4868.
Big cake
The daily line of the big cake is descending as expected, with a wedge pattern and a bullish flag breakout. The price line is above MA20, continuing the rebound trend. The young master reminded a few days ago to pay attention to the triangle breakout at the 4-hour level, and then it broke through 116000, walking back to touch the harmonic pattern targeting 118000, which has been completed.
The next resistance level is at 121000, followed by the pressure of the previous high. If it strongly breaks through, there is a chance to reach 135000, which is also the price level the young master has been looking at for the past month or two. Congratulations to friends who believe in and follow the young master.
Support: 116000 to 116800
Resistance: 121000 to 123000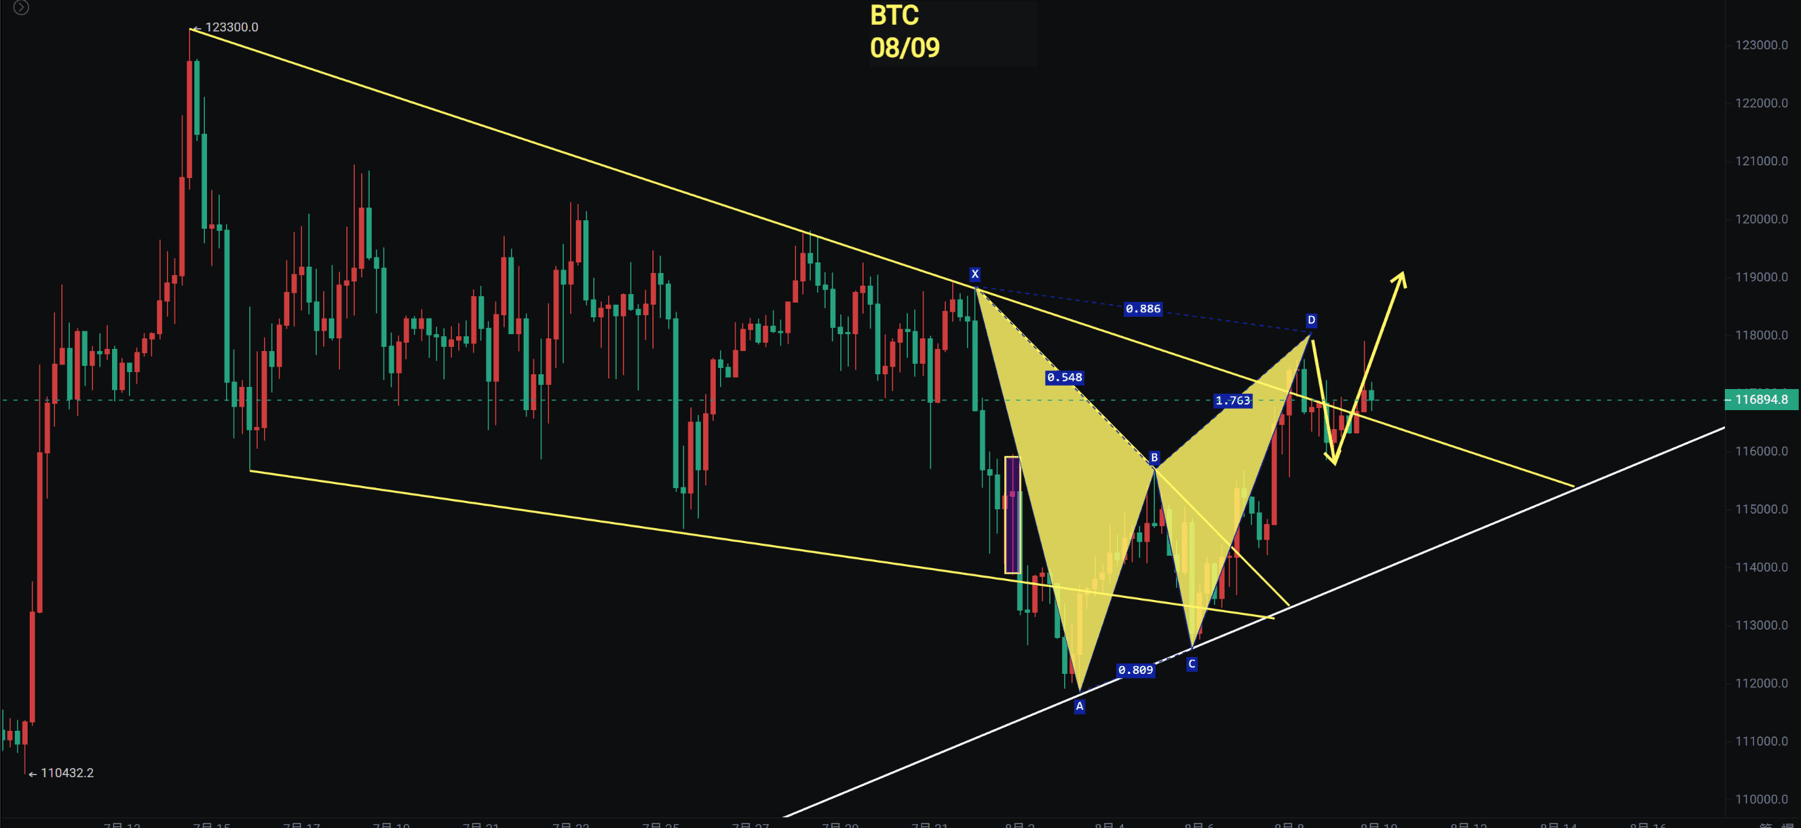
Ethereum
Ethereum broke through the phase high point of 4100, reaching a maximum of 4332. Today, the probability of closing as a doji star is relatively high, but so far there has been no increase in volume. The daily MACD has crossed the zero axis with the fast and slow lines intersecting, and the weekly line is gaining momentum. Moreover, the monthly line's bottom divergence has turned positive. As long as the price does not fall back below 3950, the trend remains unchanged. Just hold on with patience.
Support: 3800 to 3950
Resistance: 4500 to 4868