A week of indecision for the price of Bitcoin (BTC) which is moving in quite contained swings. At the time of writing, it is priced at 116,600 USD, and on a weekly basis, it records an increase of 2.02%, following last week's drop of -4.29%.
Historical scenario of August
July marked a +8.13% recording the fourth consecutive month in the green, reaching a new ATH at 123,236 USD. Statistically, August and September present a negative historical series for Bitcoin's performance, with the exception that the third quarter (Q3) of the year following the halving (like in 2025) has often marked strong increases. Therefore, it is also possible that August could surprise. In the last post-halving August of 2017, BTC recorded a +14%.
Analysis of the daily chart of Bitcoin
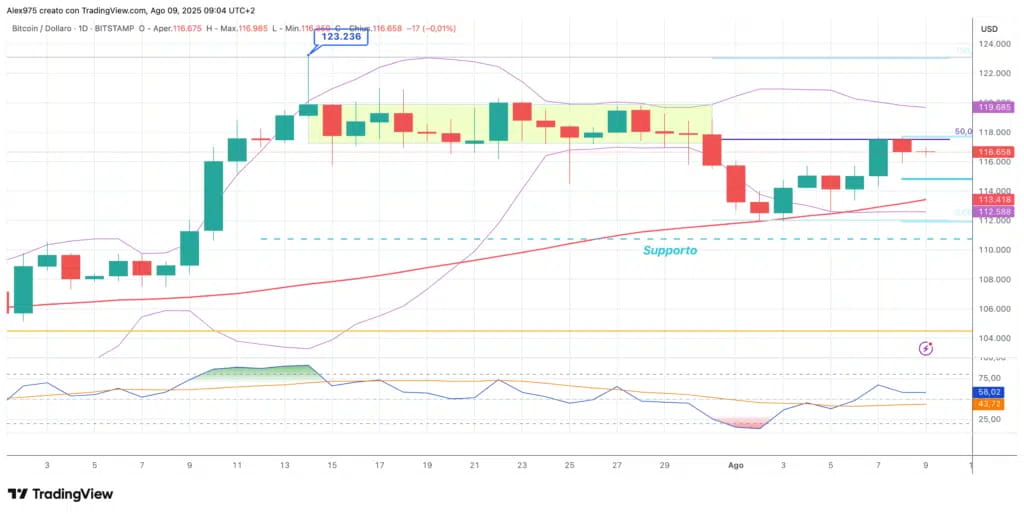
On the daily chart of Bitcoin, we start with an analysis of the trend recorded since July. The price marked its ATH at 123,236 USD on July 14, from which a congestion phase began lasting about 15 days, until the breakdown on July 31. On this date, a series of bearish closes pushed the price of BTC to rest on the SMA50 (red line), from which it then bounced.
Support and resistance levels
The first relevant support at this stage is lower at 110,800 USDT, which corresponds to the 50% Fibonacci retracement of the vector going from the June low (98,240 USD) to the July high. However, BTC did not touch it and turned before.
After testing the 50-day moving average, Bitcoin initiated a rebound phase, bringing it back towards the resistance located around 117,500 USD, a level where the price has been stalling for two consecutive days.
Bitcoin stops at the resistance of 117,500$
The price of Bitcoin has stopped at the resistance and yesterday retraced, closing with a 1% drop. In terms of indicators, the rebound phase was signaled by the RSI, which had exited its overbought area and subsequently crossed upward its average.
However, in this rise, we have not yet entered a phase of strength or overbought, which could open the doors to a further extension. It is important to remember that the overbought condition does not automatically imply a bearish reversal, contrary to what is often read.
Short-term support for BTC
In this scenario, the first very short-term support is located around 114,800 USD and could serve as a reaction level for the ongoing corrective swing. The SMA50 will also be important, representing a significant support area as already seen.
Weekly overview of Bitcoin
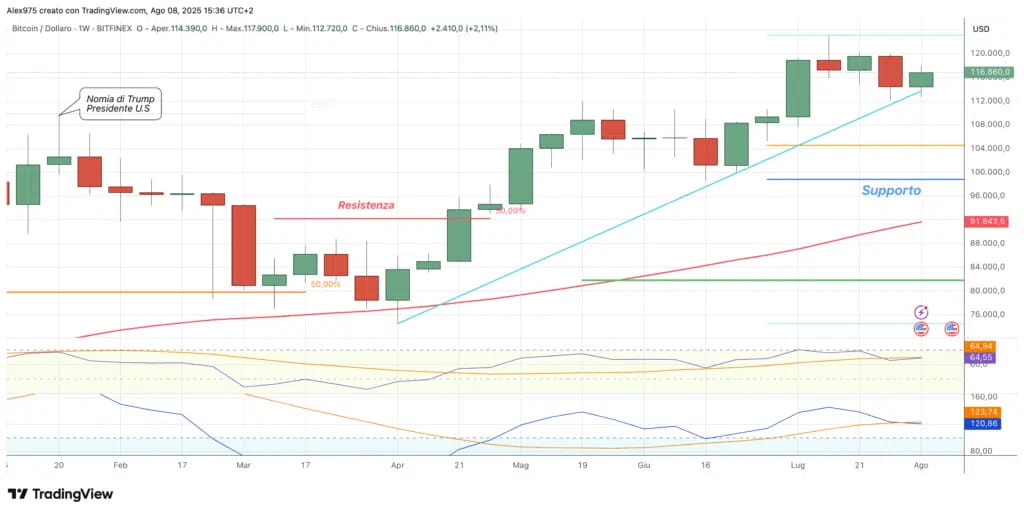
Analyzing the weekly chart situation, we observe an overview of Bitcoin in 2025. After an initial ATH in January, there was a decline phase with an April low of 74,500 USD. From this level, the leg up started until the July ATH.
On the chart, it is important to monitor the hold of the supportive dynamic trend (blue). Here, the two supports of the April low - ATH vector are also highlighted. The first is at 104,400, while the subsequent one is at 98,700 USD.
Attention to the setup of indicators
The setup of the weekly indicators is dangerously tilted, but both have not yet closed negatively the weekly candle. A negative close would lead to exiting the bullish position opened in April.