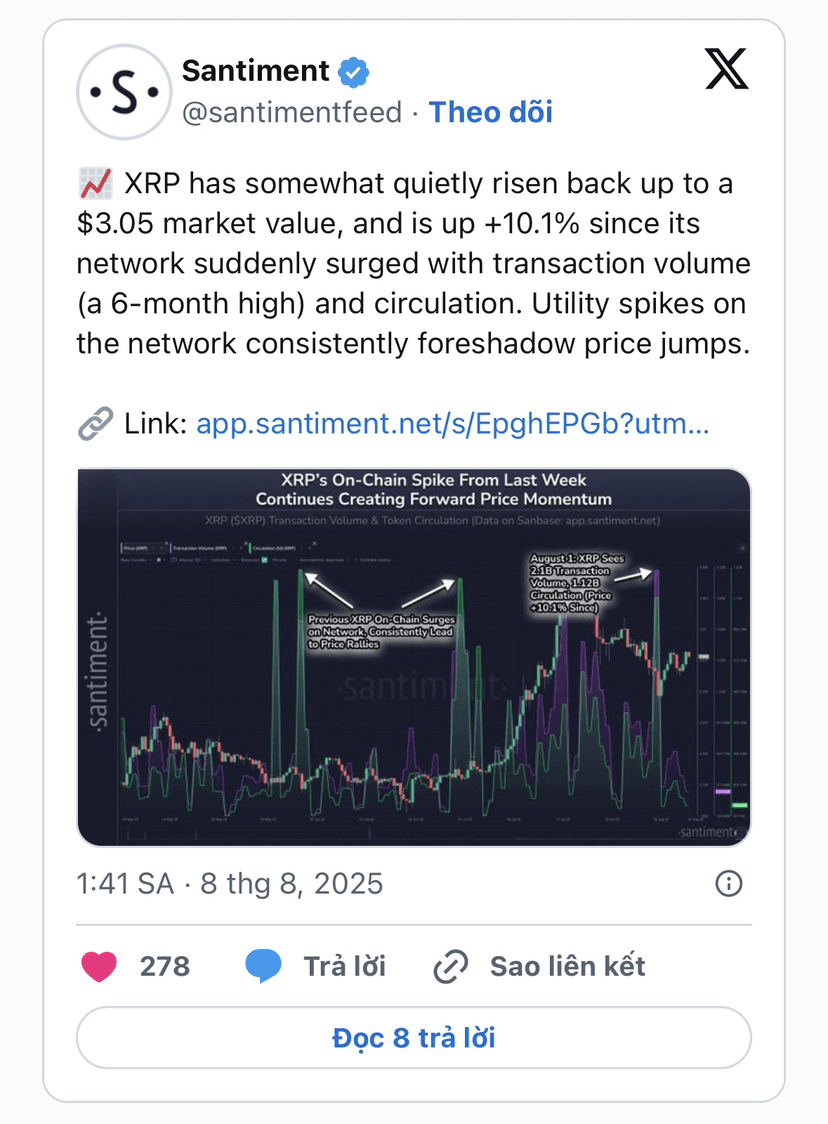
A notable technical signal has just been released by Santiment – the well-known on-chain data analysis platform – raising expectations for a strong recovery of XRP. Specifically, this company points out that spikes in the utility of the XRP network often serve as an 'early indicator' for price increases of this asset.
Santiment has analyzed two key indicators – Transaction Volume and Circulation – to assess the level of actual activity on XRP's blockchain.
Trading volume reflects the total trading volume each day, but it may be 'noisy' due to repeat or internal transactions. Conversely, circulation measures the number of unique tokens being moved, providing a more accurate view of actual user activity.
Data shows that on August 1, both of these indicators for XRP recorded a spike:
Trading volume reached 2.1 billion USD – the highest in 6 months.
Circulation increased to 1.12 billion tokens, implying that real cash flow is being activated in the network.
It is noteworthy that such explosive moves in the past have often been accompanied by subsequent price increases. And true to the old scenario, XRP has begun to recover after a prolonged period of declines.
'The surge in network utility is always a precursor signal for price increases,' Santiment asserts.
Technical analysis: Breaking out of the triangle pattern is a positive signal.
According to famous analyst Ali Martinez, XRP has broken out of the converging triangle pattern – a pattern that often suggests a breakout after a consolidation phase. Indeed, after breaking out of the triangle, the price of XRP quickly recorded a strong recovery.
However, this trend is not yet fully confirmed as the price currently oscillates around the 2.75–3 dollar range, reflecting a strong tug-of-war between buyers and sellers.

Meanwhile, analyst CasiTrades warns that if it cannot maintain above the 3-dollar level, XRP could enter a deeper correction, likely as part of the subsequent ABC corrective wave.
Current technical data shows:
After being pushed below 3 dollars, the price bounced back to test the Fibonacci support level of 0.5 at 2.75 dollars.
If 2.75 dollars is broken, the risk of an extended correction will be very high.
However, this level is still higher than the peak of Wave 1 at 2.65 dollars, a sign that XRP may still be within a larger bullish trend.
CasiTrades also notes that bullish divergences have appeared continuously across timeframes from 15 minutes to 40 hours, reinforcing the possibility that 2.75 dollars is the short-term bottom of the correction.
To confirm the new upward trend, XRP needs:
Convincingly reclaim the $3 level.
Break the resistance area of $3.21, paving the way for new bullish momentum.
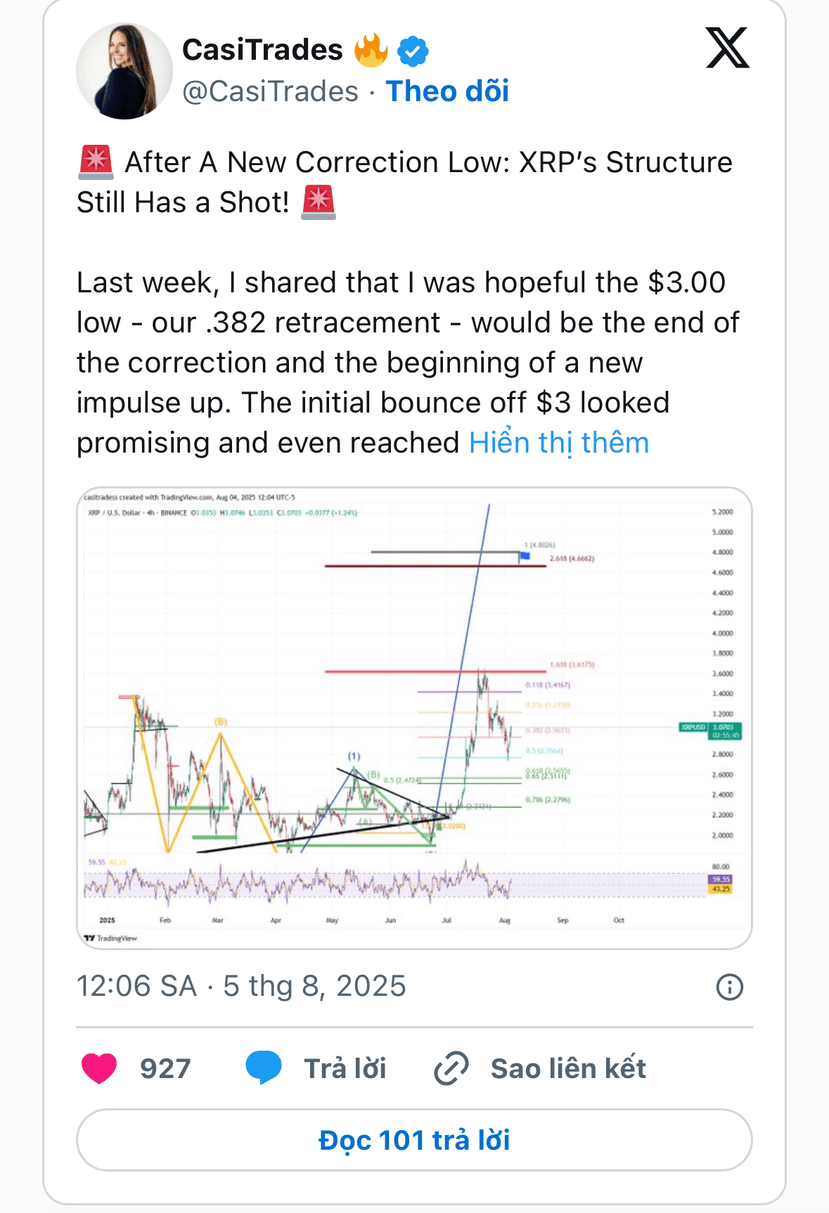
Next target: 4.6 – 4.8 dollars if the breakout is successful.
If XRP maintains its recovery and surpasses key technical thresholds, the analyst expects the price to quickly move towards the 4-dollar mark, the highest in over 7 years. Further, the potential price target could reach 4.6–4.8 dollars if the market continues its bullish momentum.
On-chain indicators, technical analysis, and network activity are all showing that XRP is at a decisive threshold. If it holds and surpasses the 3-dollar level, the market could witness a new impressive bullish cycle.
However, if it fails to defend the key support area, the correction may not be over yet.
Investors need to closely monitor fluctuations around the 3-dollar mark – a 'survival point' to determine the near future of XRP.