Ethena (ENA) continues to assert its strength as it outperforms most of the market in the past 24 hours, soaring 19.6% to $0.7363, becoming the second strongest cryptocurrency, according to data from CoinMarketCap.
The influx of liquidity is growing increasingly robust, igniting hopes for a major breakout, even opening the possibility for this altcoin to double its profits in the near future.
However, analysis from Bitcoin Magazine also issues a warning: this could simply be a 'bull trap', putting investors who buy at the current price level at risk of significant losses.
Open contracts surge, rekindling traders' risk appetite
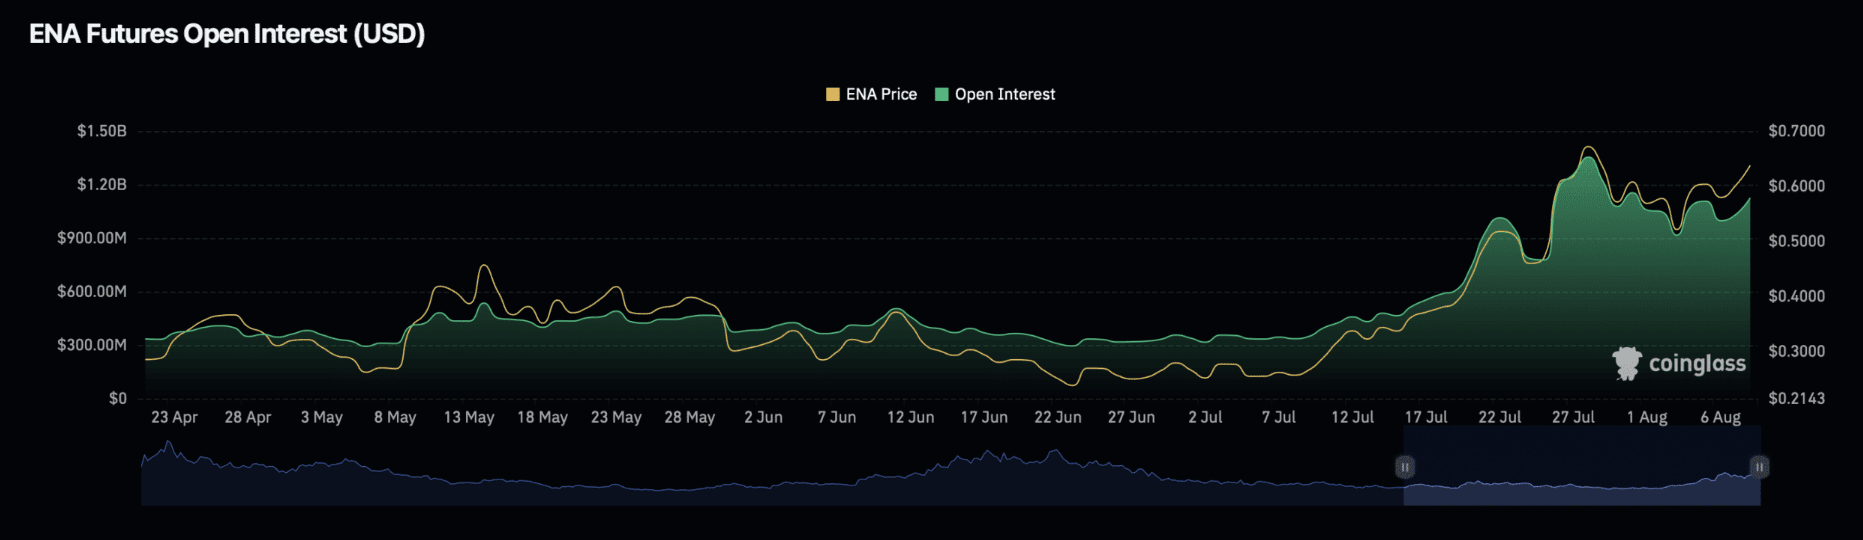
ENA's increase in the past 24 hours coincides with a large influx of capital into the perpetual futures market, as data from CoinGlass shows that open contracts (OI) have surged.
OI is a measure of the total value (converted to USD) of perpetual futures contracts that have not been settled. As of the time of writing, this index for ENA has increased by an additional $244 million, equivalent to an 18% jump, bringing the total OI value to $1.3 billion.
Not stopping there, funding rate analysis indicates that the market is leaning entirely towards a bullish trend as this index returns to positive territory.
Typically, when the funding rate remains positive — as it currently is at 0.0082% — and continues to rise, it indicates that buying pressure (Long) is overwhelming selling pressure (Short), reflecting strong confidence among bulls.
The spot market shows mixed signals.
Investor sentiment in the spot market is currently in a 'bipolar' state, as both short-term and long-term factors intertwine.
From a short-term perspective, the latest data shows a net outflow of $12 million — a not-so-positive signal for the upward momentum. Nevertheless, Bitcoin Magazine suggests that ENA still has a chance to maintain its bullish trend.
Looking at a longer-term picture, the amount of ENA withdrawn from the market over the past week still outweighs the amount deposited. As of the time of writing, the differential reached about $5.7 million, reflecting that buying pressure still prevails.
Nevertheless, in-depth analyses still emphasize caution, as the current increase could entirely be a pre-set 'bull trap'.
Is a bull trap lurking?
Data from the Liquidation Heatmap shows that liquidity clusters are densely concentrated just below the current price range – a structure that poses a hidden risk as the market may 'sweep' the liquidity above before reversing sharply.
Currently, short sellers are suffering greater losses, with $4.61 million in positions liquidated, compared to just $730,000 for long positions. However, if the trend reverses, highly leveraged long positions could become the next target, triggering a liquidity 'domino effect'.
Although both technical data and on-chain metrics still support a bullish trend, the concentration of liquidity at lower price levels leaves open the possibility of a deep reversal. If bulls maintain high leverage, the upward trend could quickly be replaced by a sharp downturn under the pressure of bears.