🔻Have you ever wondered how professionals read the market? How do they know when to enter a trade and when to exit?
The secret lies in technical indicators… Smart tools that provide you a deeper insight than just price. Here’s a simplified and inspiring explanation of the most important indicators in BNB/USDT analysis:
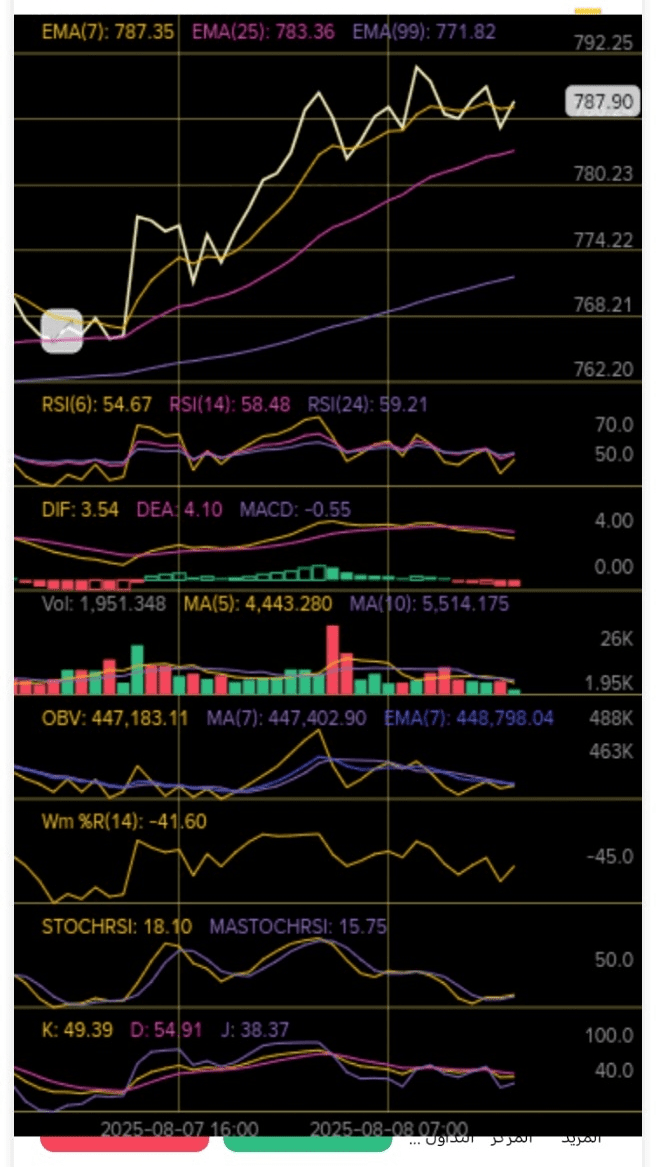
📈 Moving Averages EMA (7, 25, 99):
Shows the overall trend of the price.
- If the price is above the moving averages, the trend is upward.
- The closer the moving averages, the closer the price explosion!
✅ Use it to confidently determine entry and exit points.
♦️ Relative Strength Index RSI (6, 14, 24):
Measures market momentum.
- Above 70 = Overbought (beware of reversal)
- Below 30 = Oversold (buying opportunity)
🎯 When RSI is between 50–60, the market is in balance… and this is where golden opportunities begin!
🔄 MACD (DIF, DEA, MACD):
Tracks the crosses between moving averages to identify reversals.
- Positive crossover = Beginning of uptrend
- Negative crossover = Beginning of downtrend
🔥 Watch the difference between DIF and DEA… each point could mean a profit or a loss!
📊 Stochastic RSI and MASTOCHRSI:
Momentum indicator.
- Below 20 = Oversold (buy opportunity)
- Above 80 = Overbought (potential reversal)
⚡ Ideal for fast traders looking for precise entry points.
📌 KDJ (K, D, J):
A composite indicator that combines momentum and trend.
- Crossover of K and D gives strong entry signals.
- The J value shows the degree of deviation… the lower it is, the higher the chance of reversal.
🔊 Trading volume and OBV:
- Volume reveals the strength of movement.
- OBV measures liquidity flow.
📈 If the price rises with rising OBV, there is real support from buyers… and this is where confidence begins!
💡 Summary:
Indicators are not just numbers… they are the language of the market.
Understand it, use it, and be the trader who sees what others do not.
#BinanceSquare #Write2Earn #bnb #USDT $BNB