Do you want to transform from an ordinary trader to a professional who reads the market like an open book?
Technical indicators are your magic tools for understanding trend, momentum, and liquidity. Here’s a simplified and inspiring explanation of the most important indicators in analyzing XRP/USDT, with practical examples to help you make smarter trading decisions:
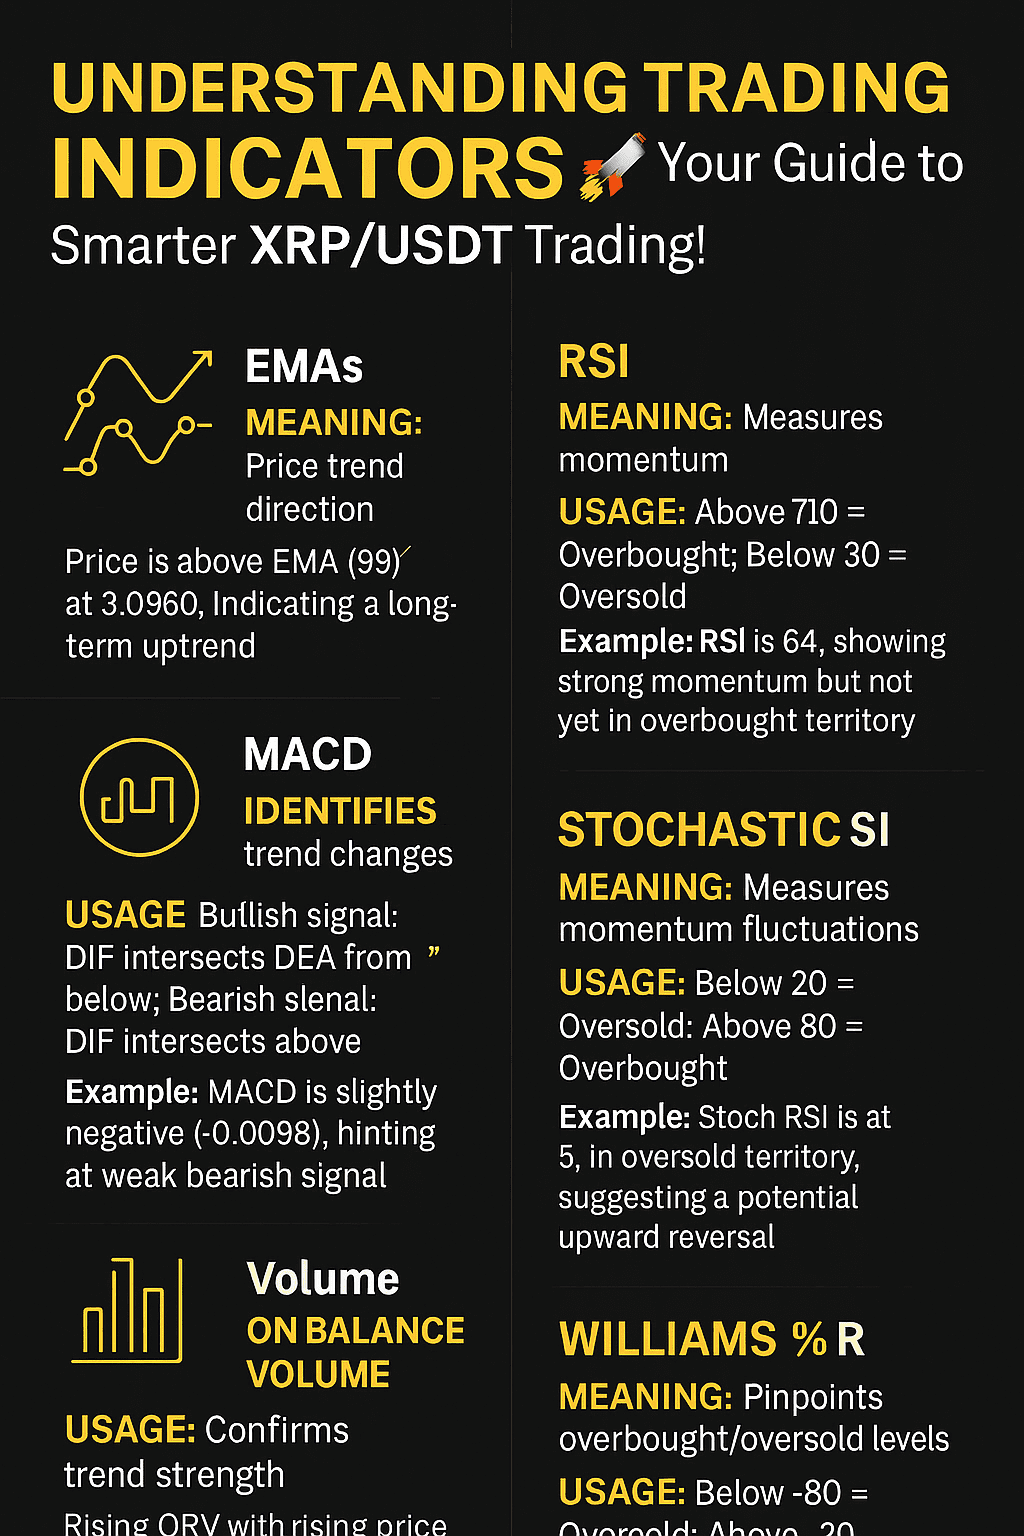
📈 Exponential Moving Averages EMA (7, 25, 99):
- Usage: Determining the overall direction of the price.
- Meaning: If the price is above the EMA, the trend is bullish; if below, the trend is bearish.
- Example: In the image, the price (3.3243) is above EMA(99) at 3.0960 ➜ the market is in a long-term bullish trend.
💪 Relative Strength Index RSI (6, 14, 24):
- Usage: Measuring momentum and determining overbought/oversold areas.
- Meaning:
- Above 70 ➜ Overbought (Potential reversal)
- Below 30 ➜ Oversold (Buying opportunity)
- Example: RSI(14) at 64 ➜ Strong momentum, but not overbought… Excellent opportunity to follow up.
🔄 MACD (DIF, DEA, MACD):
- Usage: Detecting crossovers between moving averages to identify reversals.
- Meaning:
- DIF crossover above DEA ➜ Buy signal
- DIF crossing below DEA ➜ Sell signal
- Example: MACD slightly negative (-0.0098) ➜ Weak negative crossover, may turn positive soon.
📊 Stochastic RSI and MASTOCHRSI:
- Usage: Accurately measuring the momentary momentum.
- Meaning:
- Below 20 ➜ Oversold (Entry opportunity)
- Above 80 ➜ Overbought (Beware of reversal)
- Example: STOCHRSI at 5 ➜ At the momentum bottom… Strong signal for potential upward rebound.
📌 KDJ (K, D, J):
- Usage: Identifying reversal points and momentum.
- Meaning:
- K and D crossover ➜ Entry or exit signal
- The value of J shows momentary divergence
- Example: J at 19 ➜ The market is in an oversold condition… Entry opportunity before reversal.
🔊 Trading volume and OBV:
- Usage: Measuring the strength of movement and liquidity flow.
- Meaning:
- Price increase with OBV increase ➜ Real support from buyers
- Price decrease with OBV decrease ➜ Weakness in the trend
- Example: OBV at 488 million with MA(7) above it ➜ Liquidity is slightly declining, but the trend remains positive.
📉 Williams %R (Wm %R):
- Usage: Accurately determining overbought and oversold areas.
- Meaning:
- Above -20 ➜ Overbought
- Below -80 ➜ Oversold
- Example: Wm %R at -51 ➜ The market is in a neutral area… A chance to monitor before making a decision.
💡 Summary:
Indicators are not just numbers… They are your tools for understanding the market, predicting movement, and making informed decisions.
Understand it, apply it, and start your journey towards more professional and impactful trading on Binance Square.
Every indicator is a key… Use it to open the door to opportunity!