It can be said without exaggeration that after reading and understanding this article, you have surpassed most technical analysts.
Trading volume represents divergence.
The essence of trading volume is the divergence between bulls and bears.
There can be trades only if there are buyers and sellers.
The greater the divergence, the larger the trading volume.
The key is, who has divergence with whom?
If there is a continuous large increase followed by volume, but the price hardly rises, it may indicate that large funds are exiting.
Not every day's trading volume is worth analyzing; only abnormal trading volumes at key positions need attention.
This is also the underlying logic of high trading volume in bull markets and low trading volume in bear markets.
However, if a downtrend has already formed and the market shows divergence, i.e., the trading volume increases, it is mostly a good sign.
Because disheartened retail investors never lead to a change in trend. There is a saying in the stock market: when the market is bad, low volume is hell; when the market is good, low volume is heaven; when the market is volatile, first reduce to low volume and then increase is a positive signal.
When you are ready to invest in a certain stock or cryptocurrency, and at that time the stock/cryptocurrency shows a significant volume increase, it may indicate a huge divergence between bulls and bears.
We can wait, wait for the trading volume to decrease, and for the battle between bulls and bears to yield results, then act accordingly.
One, what is trading volume
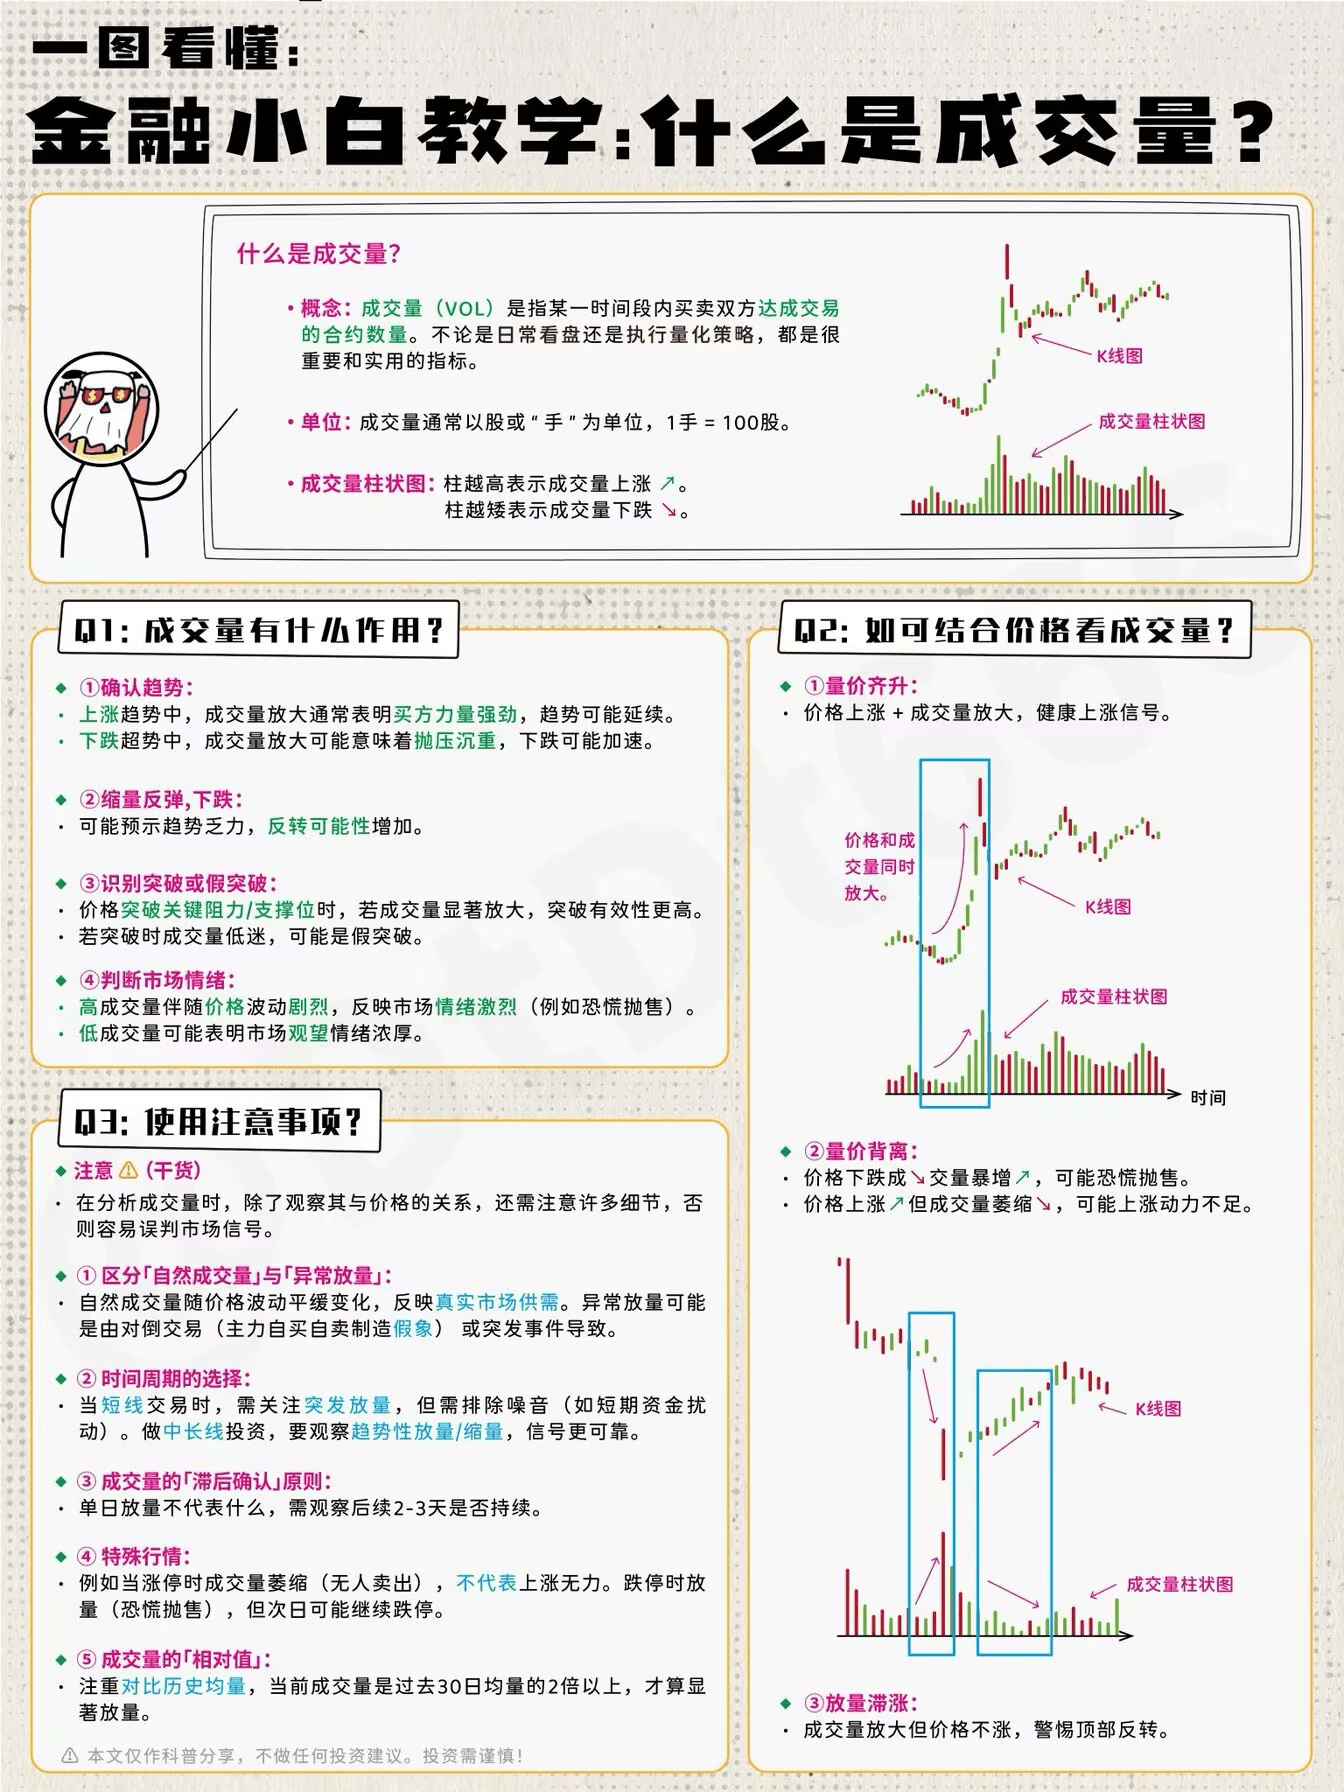
What is called trading volume refers to the amount traded between buyers and sellers within a certain timeframe. Here, I take the stock market as an example, with the unit of calculation being shares and lots, where 1 lot = 100 shares. For instance, on a certain day, a stock traded 50,000 lots, meaning its trading volume that day was 5 million shares.
Two, classification of trading volume
(1) In terms of time, trading volume can be divided into "intraday trading volume," "daily trading volume," "weekly trading volume," "monthly trading volume," and "annual trading volume." Among them, intraday trading volume can further be divided into "1-minute trading volume," "5-minute trading volume," "15-minute trading volume," "30-minute trading volume," and "60-minute trading volume." These different trading volumes can be identified by their names. For example, daily trading volume refers to the volume traded between buyers and sellers within a day. Weekly trading volume refers to the volume traded within a week.
(2) In terms of form, trading volume can be divided into "gradually increasing volume," "gradually decreasing volume," "rapidly increasing volume," "rapidly decreasing volume," and "flat volume," among other situations.
Three, the significance of trading volume
The rise of a stock can be confirmed by either large trading volumes or gradually increasing volumes; the trading volume situation reflects the degree of attraction a stock has for the public. When the public is optimistic about a stock, many people will buy it, and those holding the stock will hold on for a rise, thereby driving up the stock price. Similarly, if the public is pessimistic about a stock, holders will sell, and those without positions will not buy, leading to a decrease in the stock price. Therefore, trading volume is the ruler of stock prices.
Additionally, one point to note is: generally speaking, breaking through resistance levels and strong pressure levels requires a volume attack, that is, an increase must be accompanied by trading volume; however, when breaking down or in a downtrend, trading volume is not needed; a silent decline can happen every day until there is a resurgence in volume, indicating new funds entering the market to seize rebounds or bottom-fish. Price increase with volume increase, price decrease with volume decrease is called volume-price coordination; otherwise, it is called volume-price disconnection.
While volume is a precursor to price, it does not mean that trading volume determines everything. Among the four key factors of price, volume, time, and space, price is the most basic starting point. Without price, other factors become water without source, wood without roots. Trading volume can be used in conjunction with price for analysis, but it will never determine price changes.
Fourth, the first core logic: the size of trading volume essentially quantifies the "degree of supply and demand divergence."
The greater the divergence, the larger the trading volume; the smaller the divergence, the smaller the trading volume.
The trading volume of different "participants" has completely different meanings!
Even with the same volume increase, the volume created by retail investors following the trend and the volume from major players' smashing/accumulating has completely opposite intentions. Therefore, when analyzing trading volume, it is essential to clarify: who is buying and who is selling in this "volume."
The participants in the market can be divided into three categories, and their trading volume logic is completely different:
1. The trading volume of retail investors: mainly based on "emotional following," easily forming "ineffective volume"
The trading characteristics of retail investors are "fragmented, impulsive, with small amounts of funds." For example, seeing a stock rise leads them to chase it, while seeing it fall leads them to sell. The trading volume created by this emotional trading is often "short-term noise."
For example, if a stock suddenly has good news (such as performance forecast increase), retail investors collectively follow the trend to buy, the trading volume suddenly increases 5 times, but the stock price only rises 2%. This "volume increase but stagnation" essentially indicates that "retail investors are buying a lot, but no one is willing to take over at high prices" (the main players may be selling at this opportunity), and a pullback is highly likely — because the enthusiasm of retail investors comes quickly and leaves quickly, lacking sustained funding support.
2. The trading volume of major players/institutions: "purposeful actions" often represent "effective volume."
The funds of major players (e.g., speculators, private equity) and institutions (e.g., public funds) are large, and their trades have clear objectives (accumulating, washing out, pushing up, unloading); their trading volume often carries "planning."
For example, if the major players want to accumulate, they will not buy aggressively right away (which would push up the stock price, increasing costs), but will instead "sell while buying": first sell part of the chips to push the stock price down, scaring retail investors into cutting losses, and then quietly buy. During this time, the trading volume will show "high volume drop" (retail investors panic sell while the major players accumulate) + "volume-reducing consolidation" (after reaching the target price, retail investors stop selling, and major players buy slowly without making a big noise).
This combination of "first dropping with high volume, then consolidating with low volume" essentially means that major players are "collecting chips at low cost"; once they begin to push up, trading volume will increase again (at this time, major players actively buy, attracting retail investors to follow).
Five, trading volume must be viewed in conjunction with "position" and "trend"!
Talking about trading volume without considering position and trend is like reading expressions without context — the same "smile" could mean happiness or sarcasm.
Why is extreme volume reduction at a low level an opportunity?
A stock falls from 20 yuan to 8 yuan, dropping 60%, and then consolidates for 4 months. During these 4 months, the trading volume decreases, and finally, on a certain day, the trading volume is only 1/10 of the peak period (volume reduced to the extreme).
At this time, the reduced volume essentially means "selling pressure has been exhausted":
Retail investors who can cut losses have already done so (those who can endure a 60% drop are basically "stubborn holders" and won't move);
Major players cannot push the price down (as no one is willing to sell, and they cannot buy chips when they push down, but may instead be picked up by other funds).
If there is a sudden volume increase (for example, volume is more than three times the period of reduced volume), it is likely that "the main players have started to act" — because the selling pressure is gone, and even a small purchase can push up the stock price. This is one of the safest entry signals (cost close to that of the main players).
Why could a high-volume limit up be a trap?
A stock rises from 10 yuan to 30 yuan (an increase of 200%), and after three consecutive limit ups, it continues to show a limit up on the fourth day, but the trading volume is four times the average of the previous three days.
At this time, one should think: the main players have already made 2 times profit, why would they spend so much money to push the price limit up?
The truth may be that "the main players are selling on the limit up board":
Using a small amount of funds to push the stock price to the limit up (creating the illusion of "further increases"), attracting retail investors to line up to buy;
At the same time, break up the chips in hand into small orders, quietly sell to the retail investors lining up (more buying on the limit up board makes it easier to unload).
Once the main players finish unloading, the next day it is likely to be "high open and low close" or "direct limit down," and the volume will decrease (because after retail investors take over, no one is willing to buy at high prices, and the selling pressure will come down with no one to take it).
This kind of "high-volume limit up" is essentially "the main players using their last bit of money to trick retail investors into taking over their positions."
Six, why shouldn't we panic during a volume-reducing pullback in an uptrend?
A stock is in an upward trend (for example, rising along the 20-day moving average), rises 30% and then starts to pull back, dropping 5% for three consecutive days, but trading volume decreases by half compared to when it was rising.
A volume-reducing pullback at this time is actually a good sign:
This indicates that those who bought earlier (including major players and retail investors) have a "small divergence" — no one thinks the trend has ended, so they are unwilling to sell (there are few sell orders);
A pullback is due to "short-term profit-taking," but the buying support is not strong (those wanting to buy are waiting for a proper pullback), so the trading volume is small. As long as the stock price stabilizes near the 20-day moving average and then increases again (volume returns to previous levels), it is a signal that "the pullback has ended, and the rise will continue" — because a volume-reducing pullback proves that "the chips are well locked" (no one is selling indiscriminately), and the main players have not exited.
The "continuity" of trading volume is more important than its "size"!
Many people are excited about "single-day volume increases," but experienced investors care more about "whether the volume can continue."
For example, if a stock suddenly has a volume increase of 8% on one day, but the following day decreases by 3%, and the volume returns to the starting point on the third day — this kind of "single-day volume increase" is likely to be "funds testing the waters" (the main players check the selling pressure), or "retail investors following the trend by chance," not a real start.
On the contrary, if a stock has a high trading volume for 5 consecutive days, with daily volume being 1.5 to 2 times the average of the past 20 days, and the stock price is slowly rising (increasing by 2% to 3% each day) — this kind of "sustained moderate volume increase" is the signal that funds are "truly entering the market": because major players need time to accumulate and push up prices; it is impossible to complete it in one day. Sustained volume increase indicates that "funds are continuously being invested," and the subsequent explosive power is often stronger.
Seven, the three types of trading volume signals that should be closely monitored in practice!
Volume increase during a rise: don't just be happy, first look at the "position."
Beginners always feel that "volume increases = good news," but experienced investors will ask: where is this volume?
Volume increase at a low level (bottom area): is likely a sign of "funds entering the market."
For example, if a stock falls from 10 yuan to 5 yuan, consolidates for 3 months, and suddenly one day shows a volume increase of 6%, with trading volume three times the average of the past 20 days. This volume increase is more likely a sign that the main players believe "it has bottomed out," and start actively accumulating (even if some retail investors are selling, the main players can handle it). If it can continue to show high volume (for example, three consecutive days of high volume), it is highly likely a signal to start.
High-volume rising at a high position (more than 50% increase): be cautious of "major players unloading."
For example, if a stock rises from 10 yuan to 20 yuan, and on a certain day it suddenly hits the limit up with trading volume five times the usual. At this time, one should think: who is buying? Who is selling?
The main players may be "pulling up while selling" on the limit up board — using part of their funds to push the price to the limit up, attracting retail investors to think "it will rise further" and follow the trend to buy, while quietly selling their chips to retail investors. Once the main players finish unloading, it is likely to drop back down with reduced volume (as there is no one to take over).
Volume reduction during a rise: is it "strong" or "weak fire"? Look at the "trend".
The essence of a volume-reducing rise is that "more people are buying, fewer people are selling," but there are two situations:
Volume reduction during a rising trend: this can actually be a good sign.
For example, if a stock is in an upward channel and every pullback reduces volume while creating new highs, it indicates that those holding the stock have a "strong consensus" — they believe it can rise further, so they do not sell; those wanting to buy can only offer higher prices (even if the trading volume is not large, the price can still push up). This kind of "volume-reducing rise" is a signal that the chips are well locked, and as long as there is no huge volume smashing down, the trend is likely to continue.
Volume reduction during a downtrend: likely a "rebound trap."
For example, if a stock falls for three months, and suddenly one day shows a volume increase of 3%. This rise is more likely due to "the trapped investors have not cut losses, and short-term funds are seizing the rebound" — there are no large funds really entering the market, only small funds are stirring inside. Once the rebound reaches a certain resistance level (like the previous trapped investors' dense area), it can easily drop back with reduced volume (as no one is willing to take over).
Trading volume "divergence": price is deceiving you, but volume will not.
What is called divergence means that "price moves A, trading volume moves B"; this is the easiest risk/opportunity signal to overlook:
Price rise with volume decrease: the rise has no "foundation."
For example, if a stock rises for three consecutive days, but the trading volume decreases day by day. This indicates that "buying interest is decreasing" — the funds that previously pushed the price up are slowly withdrawing, leaving retail investors to entertain themselves. In this situation, a pullback is highly likely, for instance, a certain new energy stock rose from 20 yuan to 25 yuan, and the volume halved, later it indeed fell back to 22 yuan.
Price decrease with volume increase: is it "panic" or "accumulation"? Look at the "position."
Prices drop, but trading volume increases, essentially indicating that "more people are selling, and more people are buying." At a high position, price falling with volume increase: likely a "panic selling." For example, if a stock doubles, suddenly one day it limits down, and trading volume surges — this means major players are smashing the price without regard to cost, panic-stricken retail investors follow the trend to sell, and the ones taking over are likely other retail investors (it will probably drop further later).
Volume increase at a low price: it may be a "major player accumulating chips."
For instance, if a stock falls 60%, on a certain day it suddenly drops 5% on high volume, but then does not create new lows. The volume increase at this time may be the main players deliberately smashing the price to create panic, forcing retail investors to cut losses, while quietly accumulating chips ("high volume drop" is meant to scare out the chips, and may reverse later).
While volume is a precursor to price, it does not mean that trading volume determines everything. Among the four key factors of price, volume, time, and space, price is the most basic starting point. Without price, other factors become water without source, wood without roots. Brothers, trading volume can be used in conjunction with price for analysis, but it will never determine price changes.#美国加征关税 #香港稳定币新规 #下一任美联储主席人选 #ETH巨鲸增持 #加密股IPO季 $BTC $ETH $XRP