As August begins, the U.S. stock market is increasingly burdened. Several strategists on Wall Street have issued warnings: the current weakness may only be the prelude, and a larger-scale sell-off may be brewing—Evercore ISI's Julian Emmanuel expects U.S. stocks to pull back by 7% to 15% by mid-October; Deutsche Bank has a slightly milder view but also acknowledges that 'the probability of market weakness is increasing.' However, optimists believe that the foundation of the long-term bull market remains intact, and a significant pullback may attract bargain hunters.
Regardless of bullish or bearish sentiment, the following key signals are worthy of investor attention:
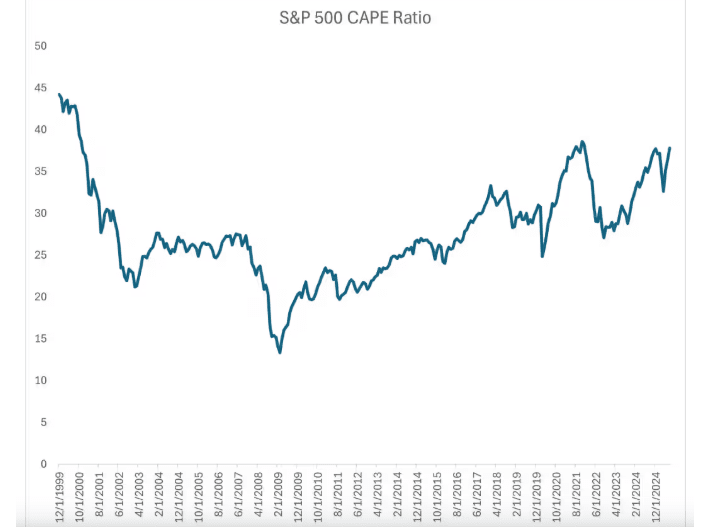
1. Valuation returns to dangerous territory: The CAPE ratio has broken through 38, with high valuation becoming a 'vulnerable point.' The cyclically adjusted price-to-earnings ratio (CAPE) proposed by Yale's Shiller broke through 38 at the end of July, reaching the highest level since the end of last year. This indicator reflects the long-term valuation of the S&P 500 adjusted for inflation, and the current level indicates that the market has entered the 'high premium range.'
Historical experience shows that similar valuation peaks are often accompanied by risks: After the CAPE ratio peaked at the end of last year, the Federal Reserve began aggressive rate hikes, and the S&P 500 subsequently recorded its worst annual performance since 2008. Although Emmanuel believes that the sharp decline of 2022 will not be repeated, he emphasizes that 'high valuations make the stock market more sensitive to negative news'—even minor economic data falling short of expectations could trigger a chain reaction.
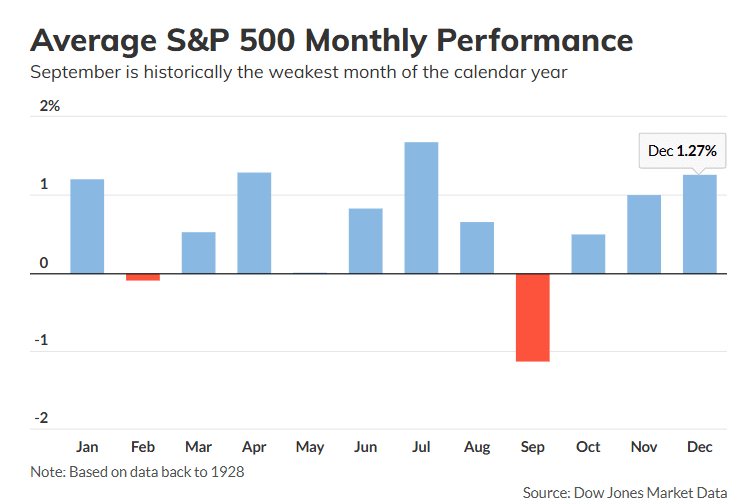
2. Seasonal 'curse' approaching: August to October has traditionally been weak, with September being a 'disaster zone.' BTIG strategist Jonathan Krinsky pointed out that the period from early August to early October is the worst performing time for U.S. stocks throughout the year, with September being especially difficult: since 1928, the S&P 500 has averaged a decline of 1.1% in September, making it the only month with a historically average loss.
Adding to the recent economic data's 'chill': July's non-farm payroll report revealed weakness in the labor market, and the ISM services index fell short of expectations, further reinforcing investor concerns about an economic slowdown. Seasonal weakness and fundamental pressures may resonate, potentially amplifying market volatility.
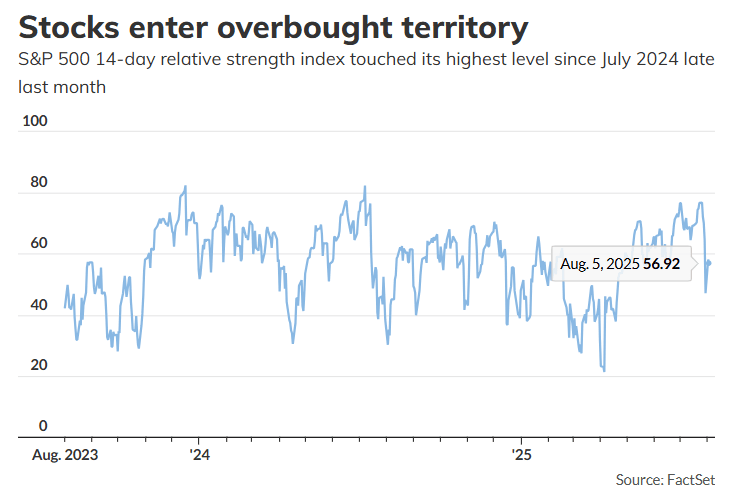
3. Technical indicators issue warnings: Initial signs of a pullback after being overbought, fear index rises.
Overbought state cooling down, but the adjustment is not over: The 14-day Relative Strength Index (RSI) of the S&P 500 soared to 76 on July 28 (far exceeding the 'overbought' threshold of 70), followed by a sell-off. Although the RSI has retreated from its peak, Nationwide strategist Mark Hackett believes the current index is still close to the overbought zone, stating that 'the pullback may have just begun.'
Fear index VIX rises: Known as the 'Wall Street Fear Index,' the VIX rebounded after hitting a year-to-date low in July, breaking above 20 last Friday (usually, a reading above 20 is considered a sign of increasing market panic). Emmanuel noted that the VIX was long below its historical average, and the current rebound may represent 'mean reversion,' but also indicates that short-term sentiment is becoming tense.
Strategic advice: Do not blindly sell, but be prepared to hedge.
In the face of potential risks, Emmanuel advises investors 'not to rush to liquidate'—the long-term bull market logic remains intact, and a significant pullback may present buying opportunities. However, short-term defensive preparations are necessary: consider hedging products (such as put options) to reduce portfolio sensitivity to market volatility.
For ordinary investors, it is currently more important to be wary of the impulse to 'chase highs' and focus on sectors with reasonable valuations and stable performance (such as consumer staples and healthcare) to cope with potential upcoming volatility.
The test for U.S. stocks in August may have just begun.
Here are some charts that investors may need to pay attention to.
Valuation returns to high levels.
The 'fear index' on Wall Street is climbing.
Today’s focus: PROVE OG PYR