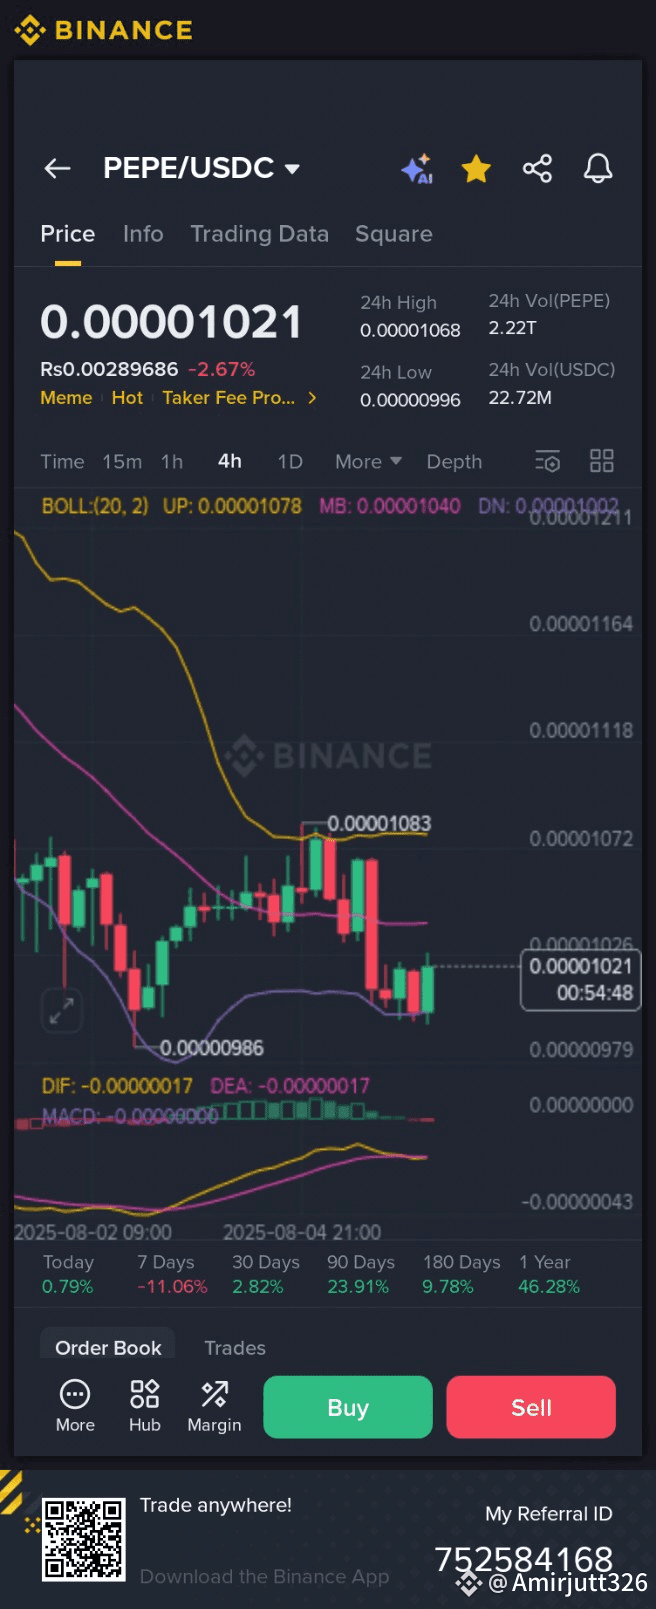
This is a 4-hour candlestick trading chart of the cryptocurrency pair PEPE/USDC on the Binance platform. Here's a detailed breakdown of what’s shown in the image:
---
📌 Key Market Data (Top Section)
Current Price: 0.00001021 USDC (price of 1 PEPE coin)
24h Change: -2.67% (Price has dropped over the last 24 hours)
24h High: 0.00001068
24h Low: 0.00000996
Volume (PEPE): 2.22T (very high trading volume)
Volume (USDC): 22.72M USDC traded
---
🕒 Chart Timeframe
Selected "4h" (Each candlestick = 4 hours of trading)
---
📊 Technical Indicators Used
1. Bollinger Bands (Yellow Line):
UP (Upper Band): 0.00001078
MB (Middle Band - Moving Average): 0.00001040
DN (Lower Band): 0.00001002
✅ Bollinger Bands show volatility. The price is currently near the lower band, suggesting the market is oversold.
2. MACD Indicator (Bottom Bar):
DIF (blue): -0.00000017
DEA (orange): -0.00000017
MACD lines are negative and flat — this indicates weak momentum, with no strong trend currently.
---
🔻 Price Action Analysis
Recent High: 0.00001083
Recent Low: 0.00000986
Current Price: 0.00001021
The price has recently bounced up from a support zone near 0.00000986 and is attempting to recover slightly.
---
📈 Trend Overview (Bottom Stats)
Today: +0.79% (slight recovery)
7 Days: -11.06% (weekly downtrend)
30 Days: +2.82% (mild gain)
90 Days: +23.91% (strong medium-term uptrend)
180 Days: +9.78%
1 Year: +46.28% (long-term uptrend)
---
✅ Summary
🔴 Short-Term Trend: Bearish (downward) — Price is below mid Bollinger Band.
🟡 Medium to Long Term: Bullish
💡 MACD: Weak movement, no strong signal yet.
📉 Possible Support: 0.00000986
📈 Possible Resistance: 0.00001083 to 0.00001068
---
📌 Entry, Stop Loss & Take Profit (Basic Idea)
Type Price (Suggested)
Entry Point Around 0.00001000 - 0.00001020 (near support)
Stop Loss 0.00000975 (just below last low)
Take Profit 1 0.00001068 (24h high)
Take Profit 2 0.00001083 (recent high)
Take Profit 3 0.00001118 (next resistance)
---