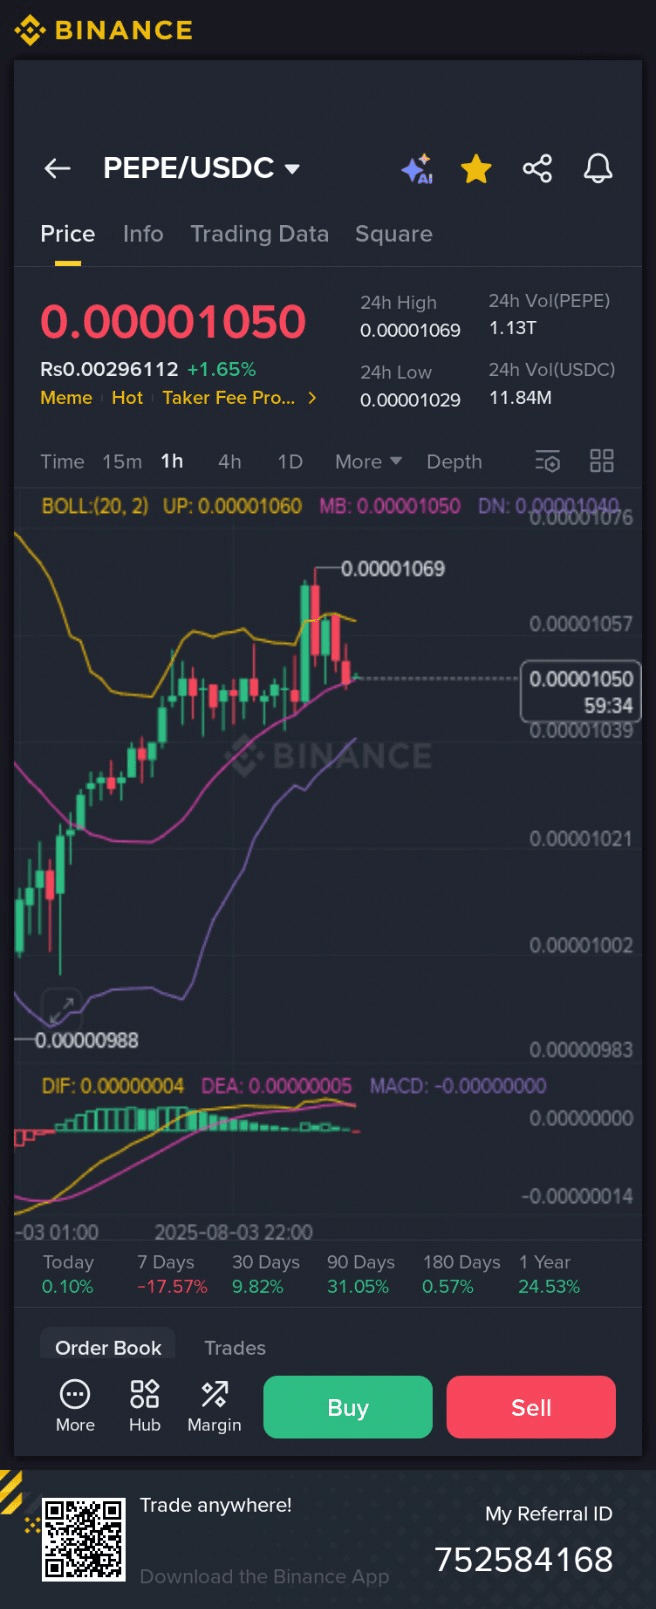
This image is a screenshot of the Binance app showing the market situation for the PEPE/USDC trading pair. Below is a complete analysis and explanation of key points:
📊 Market Overview
Current price: 0.00001050 USDC
24-hour high price: 0.00001069
24-hour low price: 0.00001029
Change (24h): +1.65%
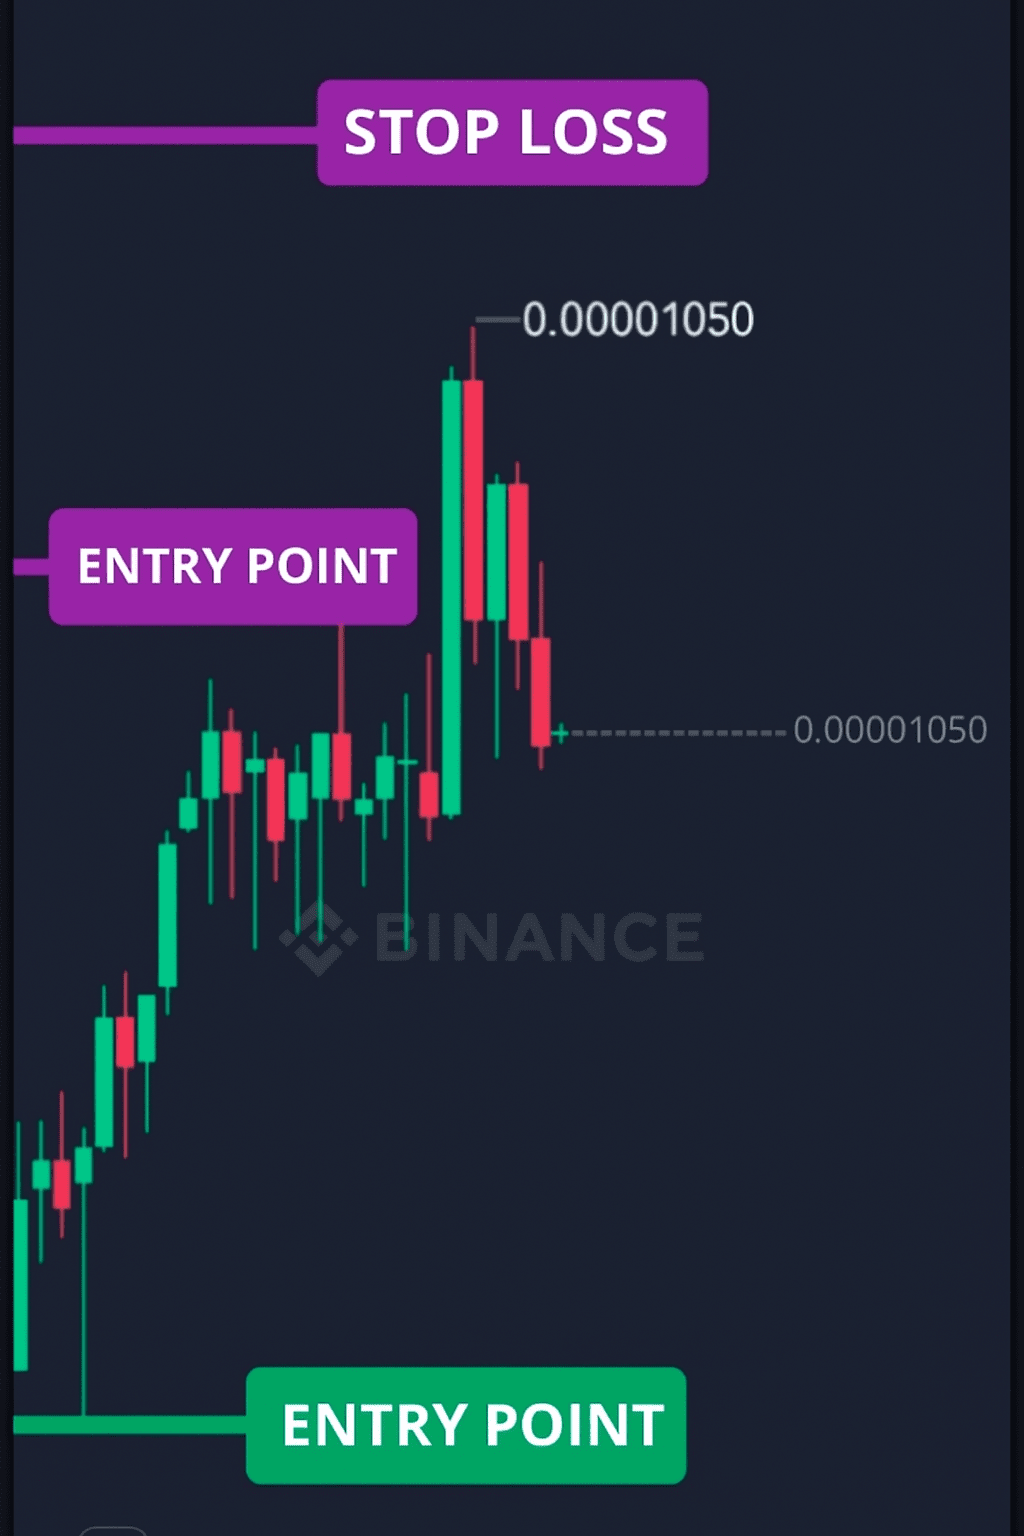
📈 Technical analysis (1-hour chart)
✅ Entry Point:
The entry point is shown in green at the bottom of the image.
The market turned upward from this point, which was a good buying opportunity.
🔄 Second entry point near the current price:
The image also has 'ENTRY POINT' written in the middle, indicating a suitable place for a potential re-entry after the market correction.
❌ Stop Loss:
The 'STOP LOSS' level is shown in a purple box in the image above.
If the price reaches there, the trade will automatically close to avoid loss.
🎯 Suggested Take Profit:
If you enter at 0.00001050, possible take profit level:
First target: 0.00001069 (recent high)
Second target: 0.00001080 (next resistance level)
📉 MACD and Bollinger Bands analysis:
The MACD line is nearly flat, which means the market may be preparing for a significant change.
Bollinger Bands mid-point (MB) = 0.00001050, indicating that the price is at the midpoint of the bands — the market is normal or in consolidation.
🔁 Suggestion:
Buy: If the price drops below 0.00001040 and holds the support.
Stop loss: around 0.00001029.
Take profit: above 0.00001069.
$PEPE .


