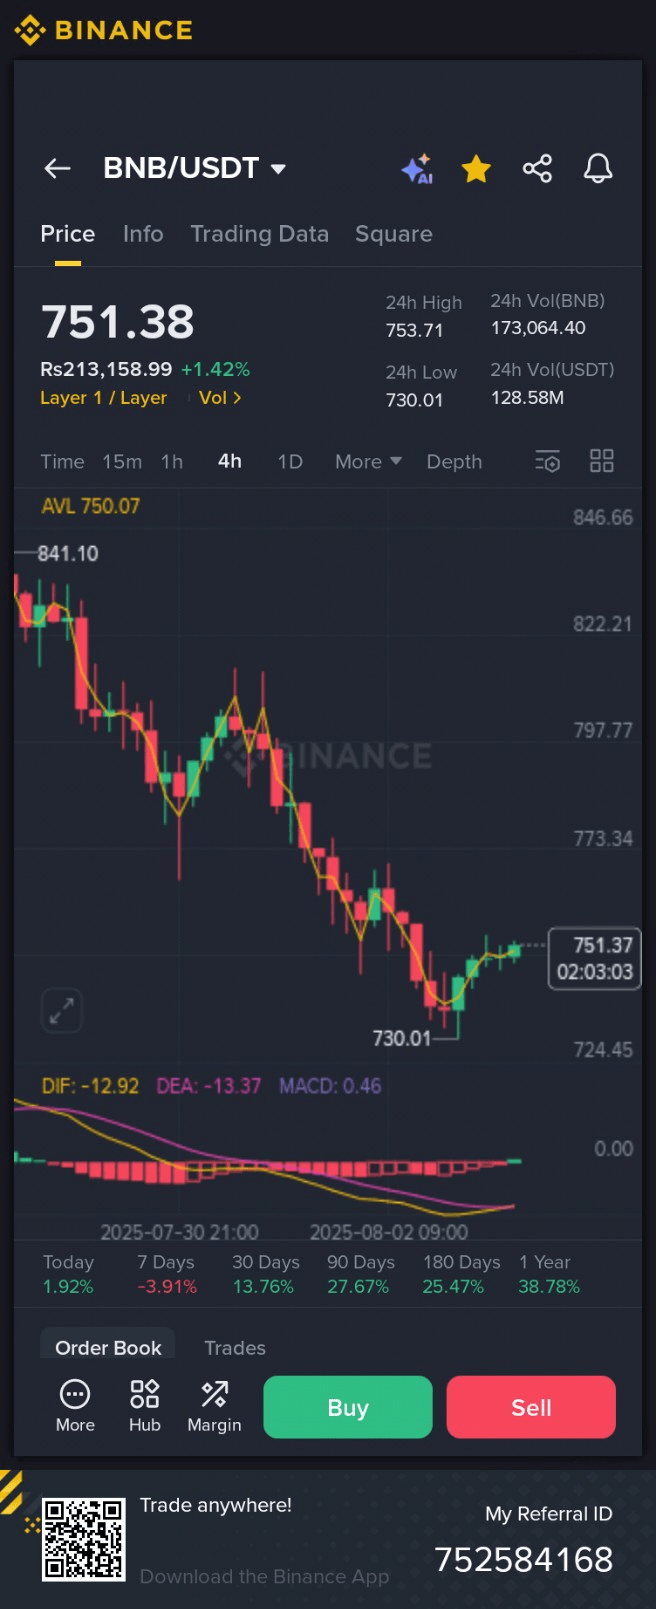
This chart is for BNB/USDT (Binance Coin and USDT), available on Binance, with a time frame of 4 hours (4h). Let's understand in detail what this chart and indicators show:
---
📊 Current Market Situation:
Current Price: 751.38 USDT
24-hour Highest Price: 753.71
24-hour Lowest Price: 730.01
Change: +1.42% (Price is increasing)
---
🕯️ Chart Analysis (Candlestick):
Recent candles have more green, indicating that buyers are active.
The price has started to move back up from 730.01, which can act as a support level.
The current trend appears to be upward, but the momentum is slow.
---
📉 MACD Indicator:
DIF: -12.92
DEA: -13.37
MACD: +0.46 (Positive crossover has occurred)
This indicates that the market is gradually improving and a possible bullish reversal may occur.
---
📈 Performance:
Today: +1.92% Increase
7 Days: -3.91% Decrease
30 Days: +13.76% Increase
90 Days: +27.67% Increase
180 Days: +25.47% Increase
1 Year: +38.78% Increase
This indicates that BNB has performed well in the long term, although there has been some decline in recent weeks.
---
📌 Summary (World Analysis in Urdu):
1. The market is now turning from down to up (a bullish signal is visible).
2. The MACD indicator has given a positive cross, indicating further increases in the future.
3. 730.01 proved to be a strong support, prices bounced back from there.
4. If the price breaks 753.71, the next target could go towards 773 - 797.
---
✅ Trading Advice:
Entry Point: 745 – 750
Stop Loss: 729
Take Profit: 773 – 790
If you want confirmation, let the price close above 755; this will further clarify the strength of buyers.
---
Please let me know if you need further guidance or have any specific questions.

