
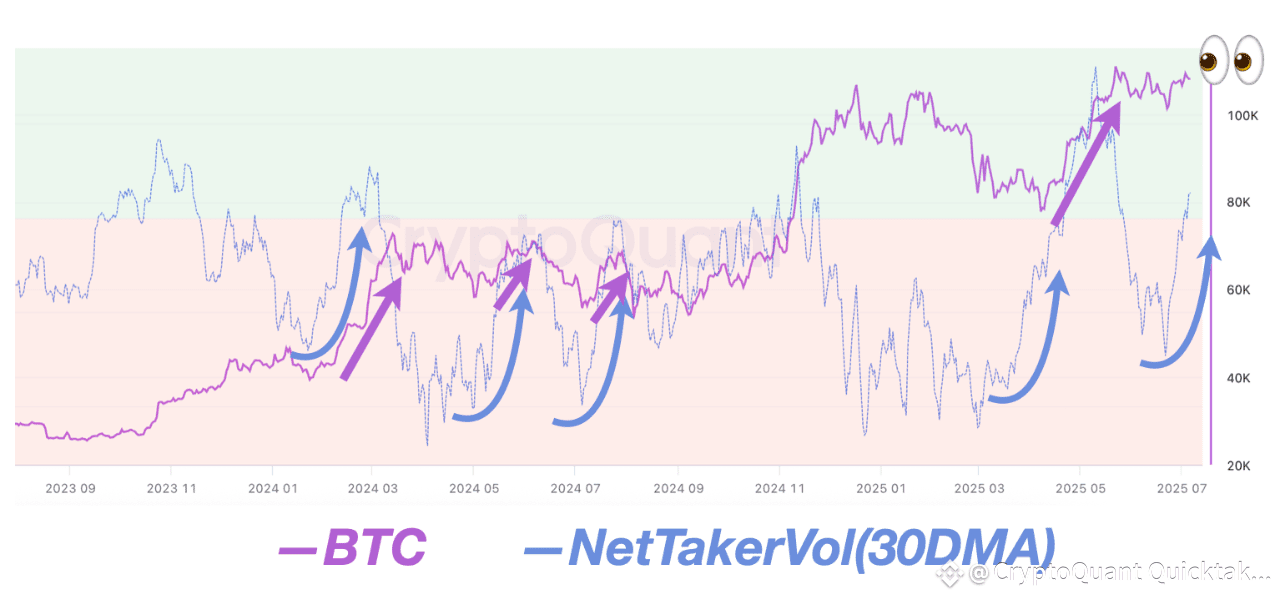
The thick purple line represents the price of Bitcoin, while the thin blue line represents the taker buy and sell CVD. The “taker buy and sell CVD” shows the trend in the difference in trading volume between long and short positions.
The green area is when longs exceeds shorts and the red area is when shorts exceeds longs.
Although the current price is showing a downward and sideways trend, traders are seemed to prefer long positions over short positions.
This is because every time this indicator hit bottom and rose in the past, the price showed a pattern of rising, whether large or small.
Let's see if the Bitcoin price can overcome the US employment shock and rebound!
Written by SignalQuant
