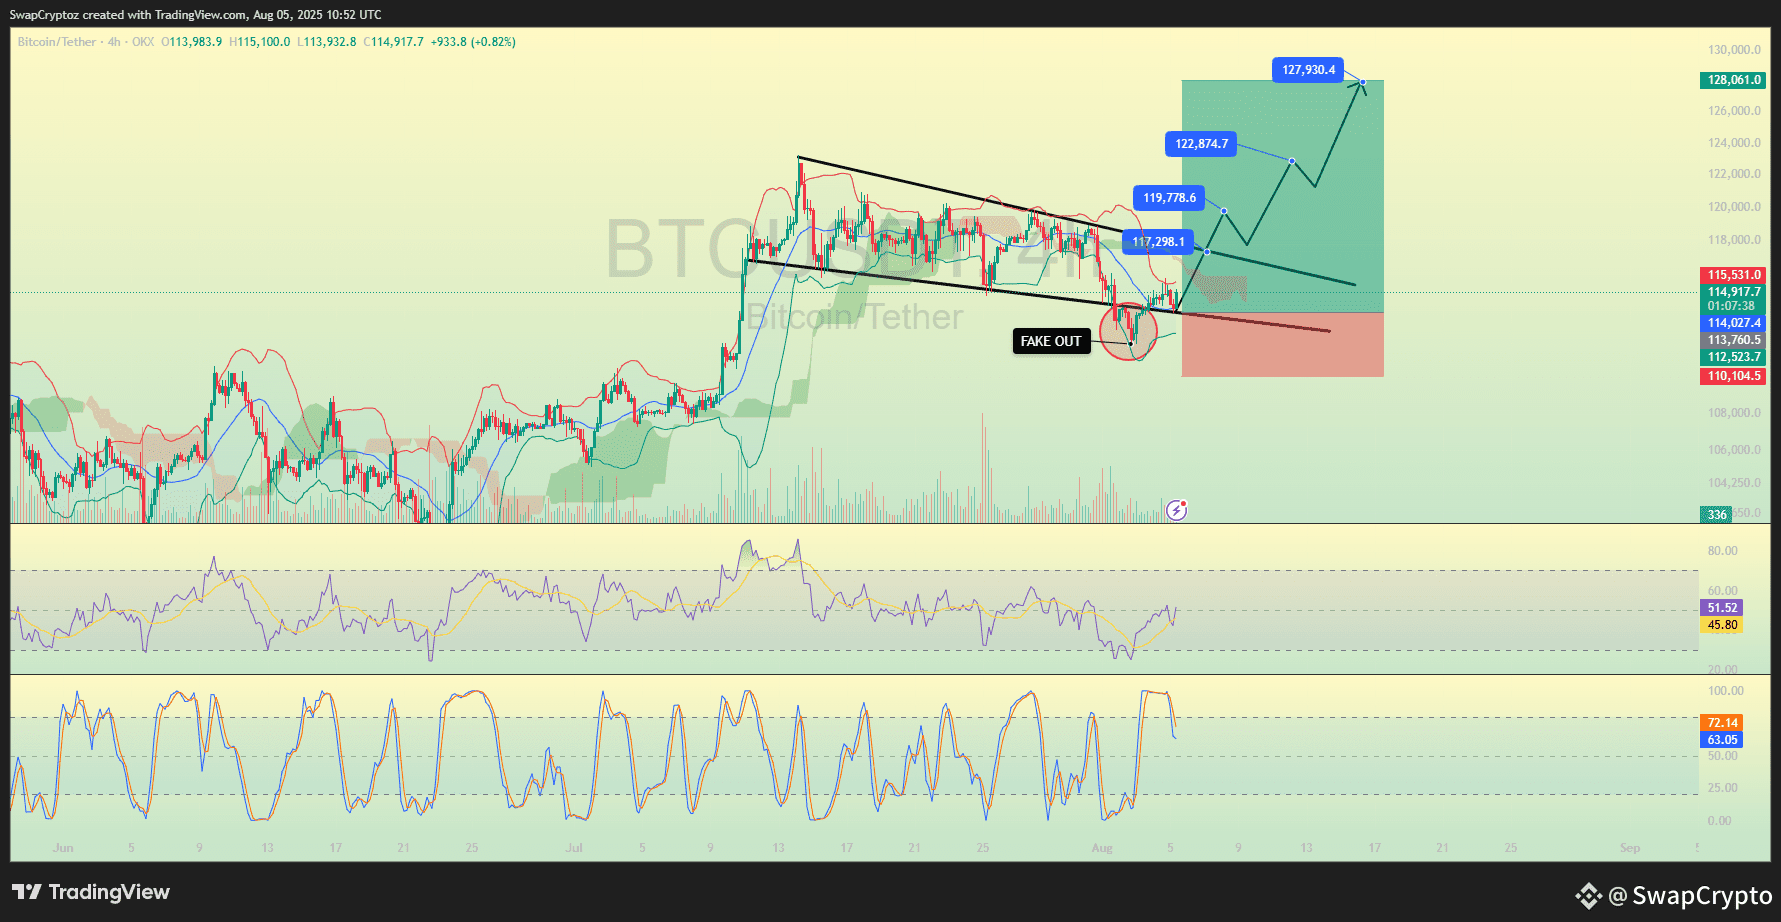
Bitcoin just faked out bears and jumped back into the falling wedge pattern – a classic bullish signal! The breakout candle is backed by strong volume 🔥, showing buyers are stepping in with force. 📊 Bollinger Bands are starting to expand, hinting at incoming volatility. RSI is climbing up from the midline 💪 (currently at 45.77), while the Stochastic RSI is giving a fresh bullish crossover from the oversold zone 📉➡️📈. With key resistance flipping into support, BTC looks set for a strong rally in the coming days.
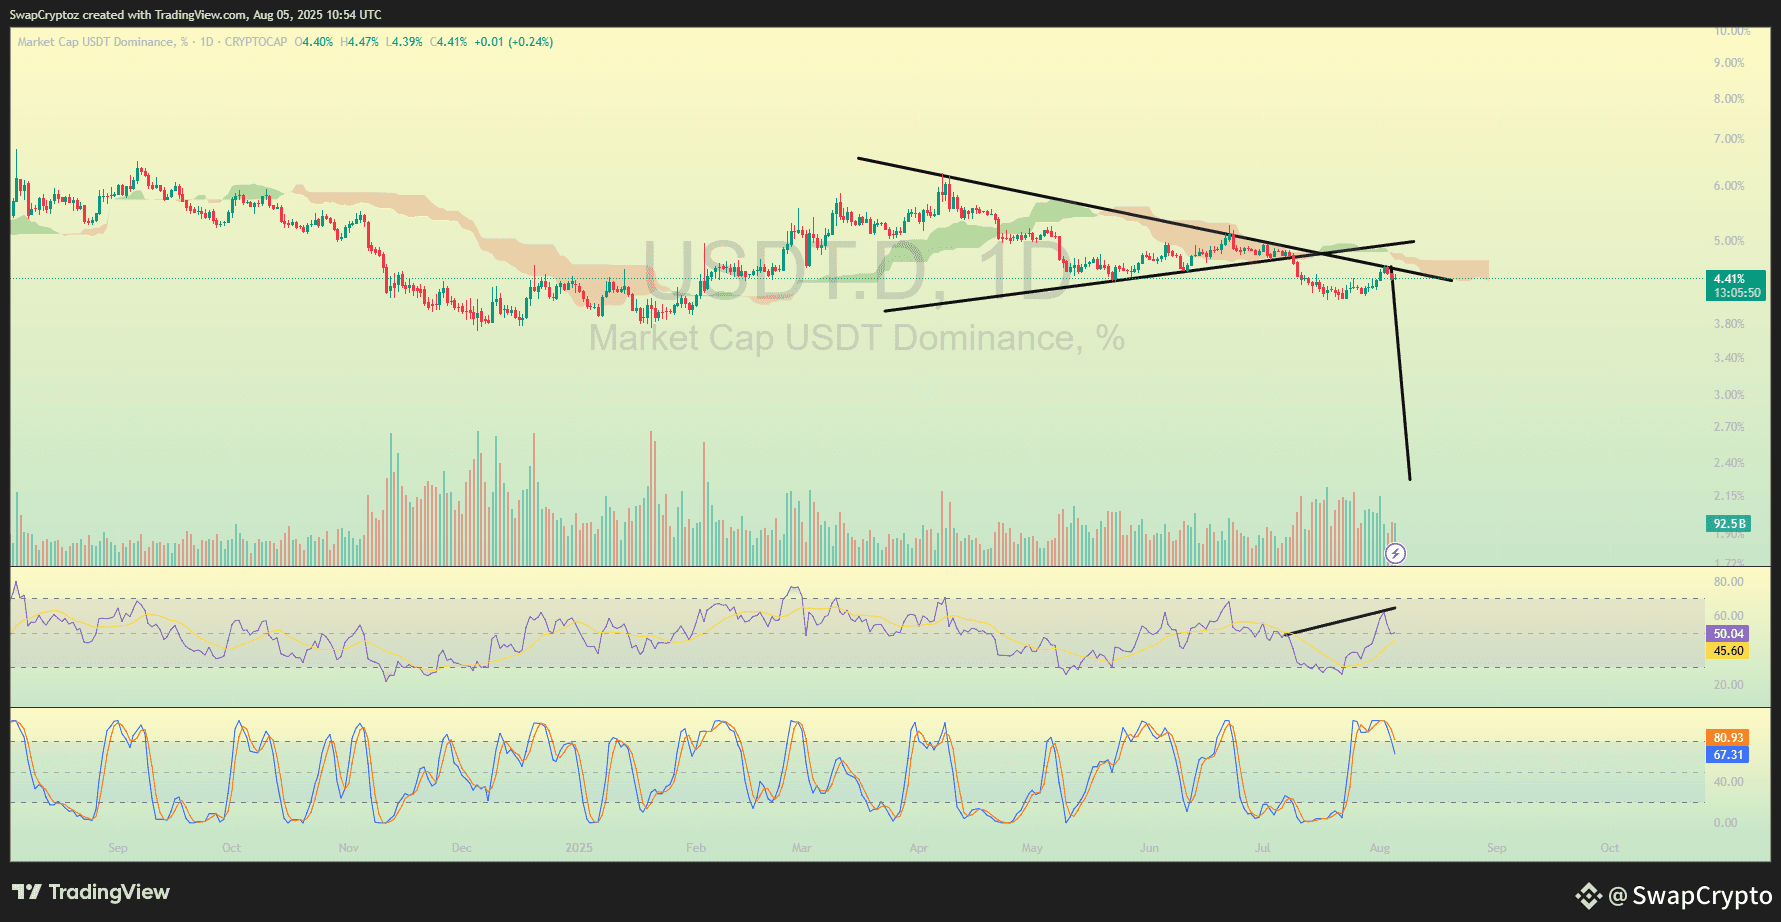
This USDT.D chart is flashing some strong bearish signals 👀. It’s hitting that resistance line again and struggling to push through, just like before. The RSI is already overbought and showing bearish divergence, meaning momentum is fading. Stochastic RSI is also way up—usually a sign it’s about to drop 📉. If USDT.D starts falling from here, that’s a big green light for Bitcoin to pump 🚀. All eyes on the next move!
✨ ENTRY: $114,025
🎯 TP1: $117,298
🎯 TP2: $119,778
🎯 TP3: $122,874
🎯 TP4: $127,930
🛑 STOP LOSS: $110,104
For more details, check out my bio by clicking on my profile.
This signal is only for spot if you want future signals join my binance live.
Just click on my profile to join my live.
#swapcryptoz #BTC #BTCUSDT #BTCbullish