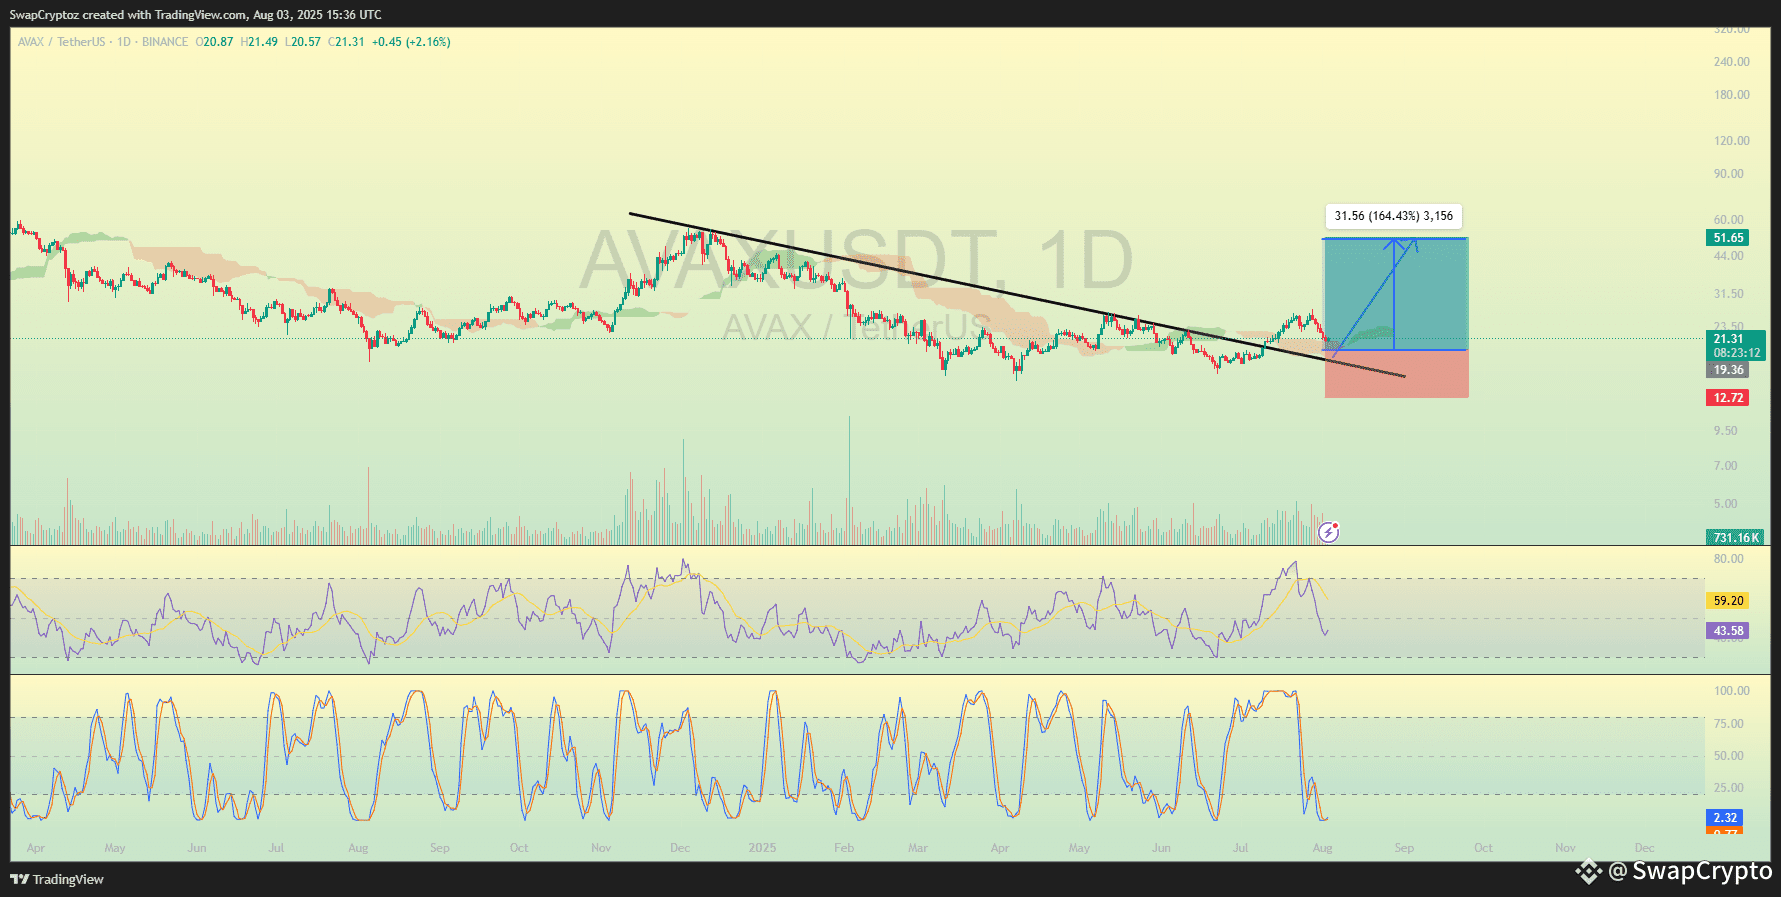
AVAX has officially broken out of a long-term descending trendline, signaling a potential trend reversal. The price is now trading above the Ichimoku cloud, indicating bullish momentum. RSI is currently pulling back from overbought levels but still above the midline, hinting at strength in the trend. Meanwhile, the Stochastic RSI has reset to the oversold zone, suggesting another upward push could be coming. Volume has shown a healthy spike during the breakout, giving this move more credibility. If this breakout sustains, AVAX could rally significantly in the coming weeks.
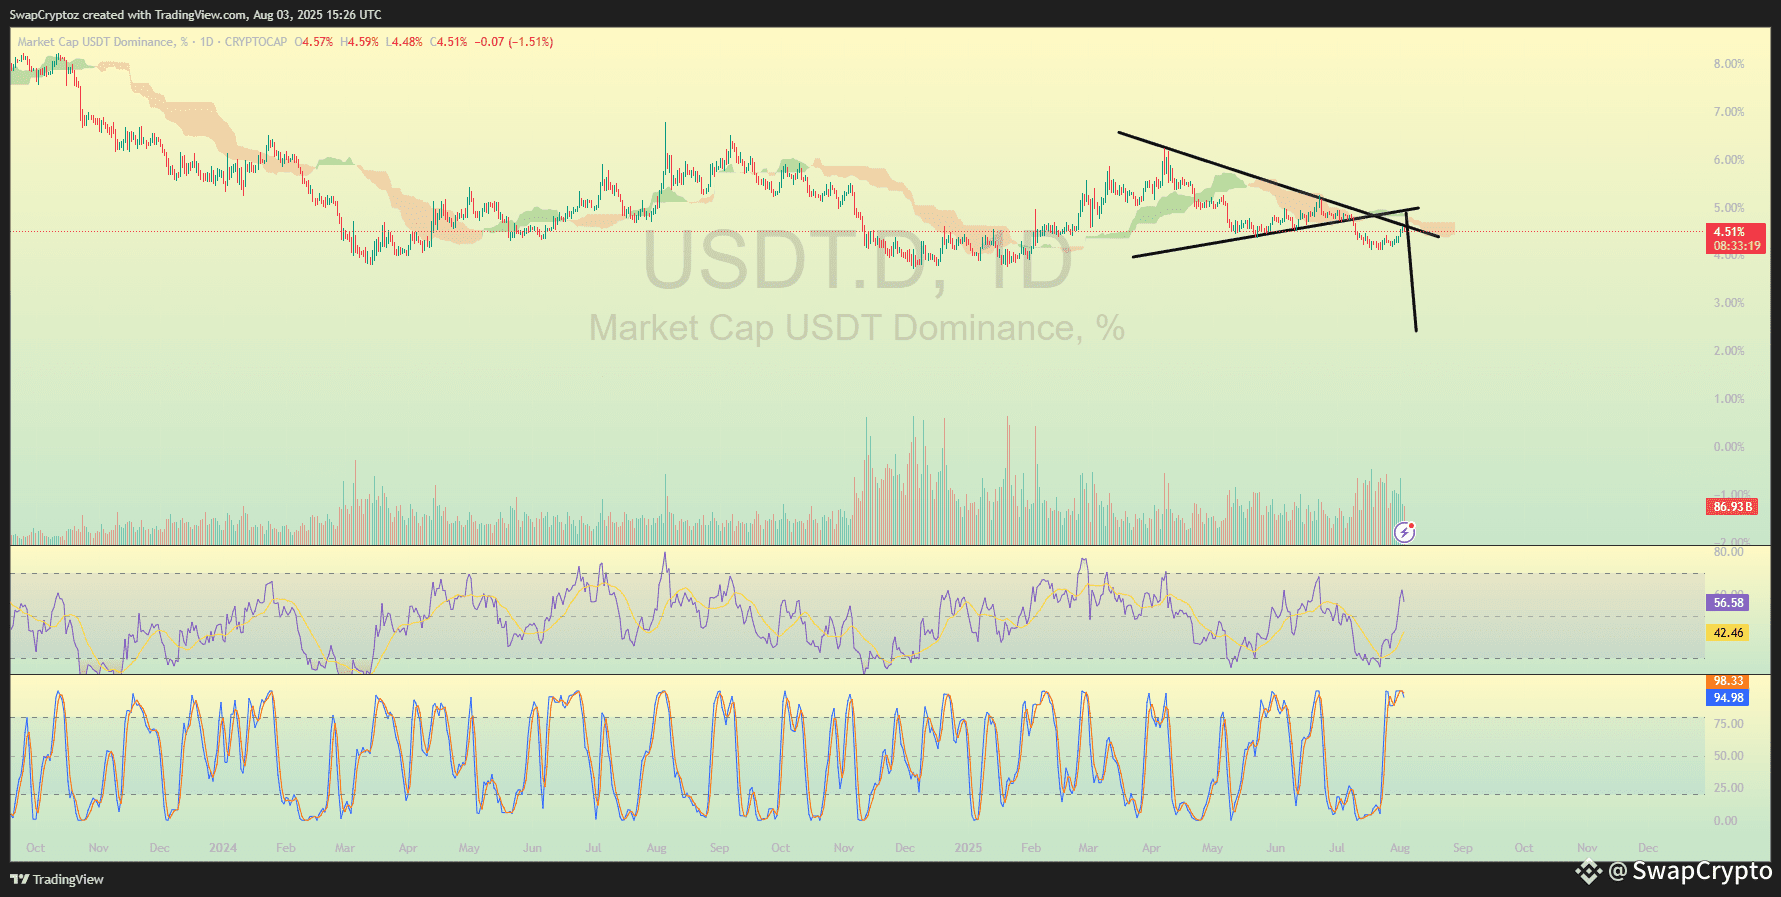
🔻 USDT.D Rejection Signals Bullish Momentum for AVAX 🔺
Based on the latest analysis, USDT.D is once again respecting its major resistance line, as shown by its repeated rejections. The RSI was in the overbought zone during the touch, indicating exhaustion in dominance strength. Historically, whenever RSI reversed from this level, USDT.D followed with a drop — and we’re seeing the same setup again. The green horizontal line remains a strong support zone, but the current structure suggests a clear downtrend forming.
This bearish pressure on USDT.D opens the door for altcoins like AVAX to rally. As dominance falls, liquidity is likely to flow into AVAX, which has already broken out of its long-term downtrend.
📥 Entry: $21.22
🎯 TP1: $26.31
🎯 TP2: $34.52
🎯 TP3: $52.11
🛡️ SL: $12.60
For more details, check out my bio by clicking on my profile.
This signal is only for spot if you want future signals join my binance live.
Just click on my profile to join my live.
#swapcryptoz #AVAXUSDT🚀 #Avax🔥🔥