In the June report, we pointed out that due to sufficient wash trading and significant amounts of chips entering institutional hands, the next surge may be completed quickly in the short term. We originally expected this breakthrough to occur in August or September, but if expectations for interest rate cuts drive forward-looking buying and structural allocations accelerate, there is a possibility that the surge will occur earlier in July.
The market rose as expected, and we saw this expectation quickly realized in July. BTC rose 8.01% throughout the month and tested the historical high of $120,000.
Behind this is the material support formed by enthusiastic corporate purchases, continuous inflows of ETF and stablecoin channels. However, expectations for interest rate cuts and the actual situation of the tariff war have changed significantly, suppressing the rapid surge in prices and temporarily interrupting the unfolding of Altseason. There are still many uncertainties regarding whether interest rates can be cut in September.
Since 2023, American individual investors and businesses have gradually increased their allocation to cryptocurrency assets represented by BTC, and by November 2024, after Trump is elected as the 47th President of the United States, BTC will be established as a national strategic reserve, promoting a series of crypto-friendly policies, marking a complete departure from the wilderness era for the cryptocurrency and blockchain industry.
However, deep participants in the cryptocurrency market are facing a starkly contrasting situation. On one hand, BTC is being increasingly accumulated by new funds for the long term, gradually pushing prices to new levels; on the other hand, Altseason seems never to return, with Ethereum, seen as the cornerstone of the blockchain industry, falling to $1,300 in April, below the price at the beginning of this bull market, leaving market participants lamenting 'faith has been shattered'. However, ETH quickly rebounded by 48.80% in July.
EMC Labs believes that the cryptocurrency industry is at a historical turning point, with a complexity of structural changes and a trend that insiders have never seen before, presenting huge challenges. The factors determining asset prices have undergone tremendous changes, transitioning from previous supply-demand cycles and speculative booms to the emerging asset allocation logic within the chessboard of all asset types.
We are in the torrent of industrial transformation.
Macroeconomic Finance: Inflation rebound vs. non-farm employment surprise.
In July, the U.S. capital market was mainly controlled by the game of three major variables: 'when the Federal Reserve will restart interest rate cuts + how the tariff war will end + the performance of economic and inflation data', with a slightly frenzied forward-looking trading dominating the market, showing a mostly bullish sentiment, and adjusting at the end of the month after the news exceeded expectations.
The month was full of drama regarding the Federal Reserve's restart of interest rate cuts. On one hand, Trump continuously exerted extreme pressure on social media, even directly visiting the Federal Reserve to intimidate Chairman Powell; on the other hand, the Federal Reserve adhered to a dual mission of 'inflation + employment', maintaining a data-driven approach and making 'hawkish' statements after the FOMC meeting. There was a split within the Federal Reserve, with governors Waller and Bowman clearly supporting a quick rate cut, and Governor Kugler unexpectedly resigning.
After the FOMC meeting on July 31, the FedWatch pricing for interest rate cuts in September briefly fell to a low of 41%, but after the unexpected non-farm data for July was released on August 1, this probability quickly rose to over 80%.
For most of the time, the S&P 500 was driven by expectations of an interest rate cut in September and strong corporate earnings. After July 28, with the probability of a September rate cut decreasing, the market began to adjust after three consecutive months of significant gains. BTC also fell below $115,000, while Altcoins represented by ETH fell even more.
The Federal Reserve Chairman emphasized in a speech after the FOMC meeting that the impact of tariffs on inflation data may further increase in the next two months.
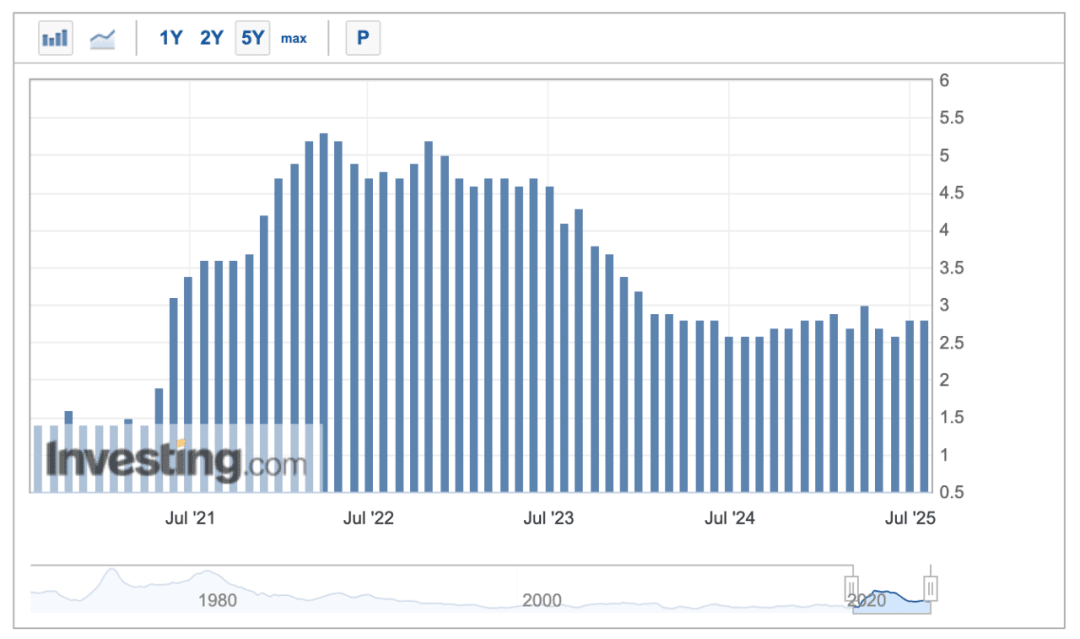
U.S. PCE data.
In July, Trump's announcement of the tariff rates for more countries indeed exceeded market expectations. After two months of silence, the tariff war, which is in the process of concluding, once again became a major factor affecting market pricing.
The current 'reciprocal tariff' system has a four-layer structure of '10% baseline + 15-41% country gradient + EU special formula + 40% transshipment penalty'. The highest bracket of 41% is mainly aimed at high-risk regions for geopolitical security; the mid-range of 25-35% targets partners with large surpluses, high barriers, and limited negotiation progress; the 10% baseline is widely applied and serves as a temporary plan against China.
Among the major trading countries/regions, the EU is 15%, Canada 35%, Japan 15%, South Korea 15%, Mexico 10% (general goods)/25% (cars, etc.)/50% (steel, aluminum, copper) (still under negotiation), and China 30% (postponed for 90 days pending). This result exceeded market expectations and increased concerns about rising inflation, prompting the market to lower its pricing for rebalancing around August 1.
In terms of economic and employment data, the overall U.S. economy shows a trend of 'relative resilience + relatively strong growth'. The Q2 GDP annual rate released on July 30 was 3%, reversing the negative growth trend of Q1 and exceeding expectations. The financial reports released by large tech companies in July also show that the AI wave is driving large enterprises to increase their investments, and AI investments have begun to drive profit growth.
Of course, there are also hidden concerns behind the data; consumer recovery remains weak, and overall corporate investment continues to be lackluster.
The non-farm data released on August 1, showing only 73,000 new non-farm jobs in July, significantly below the expected 110,000, also dealt a heavy blow to the market, causing a sharp decline in U.S. stocks. Additionally, the non-farm data for May was revised down from 144,000 to 125,000, and for June from 147,000 to 134,000, totaling a downward revision of 258,000 over the two months. These data significantly exceeded market expectations, renewing fears of a 'soft landing' and completing downward pricing for rebalancing.
Throughout the month, the market rose exuberantly under expectations of interest rate cuts and no economic landing, but the tariff rates and non-farm employment data released at the end of the month severely impacted the market's downward pricing.
Throughout the month, the Nasdaq, S&P 500, and Dow Jones indices rose by 3.7%, 2.17%, and 0.08%, respectively. BTC rose by 8.01%, and ETH rose by 48.8%.
In August, there remains a risk of further downward rebalancing in the U.S. stock market; after the non-farm data surprise, the probability of a September rate cut returned to 80%. However, concerns about inflation rebound continue to hinder expectations for rate cuts, and while the employment data has not fundamentally impacted the overall growth of the U.S. economy, it still poses challenges.
Whether interest rates can be cut as scheduled in September remains to be seen, with upcoming inflation and non-farm employment data being closely watched.
Cryptocurrency assets: BTC is in a rising continuation, Altseason may open.
In July, BTC opened at $107,173.21, closed at $115,761.13, with a low of $105,119.70, and set a historical high of $123,231.07 during the month, achieving a monthly increase of 8.01%, a volatility of 16.9%, and a significant increase in trading volume compared to June.
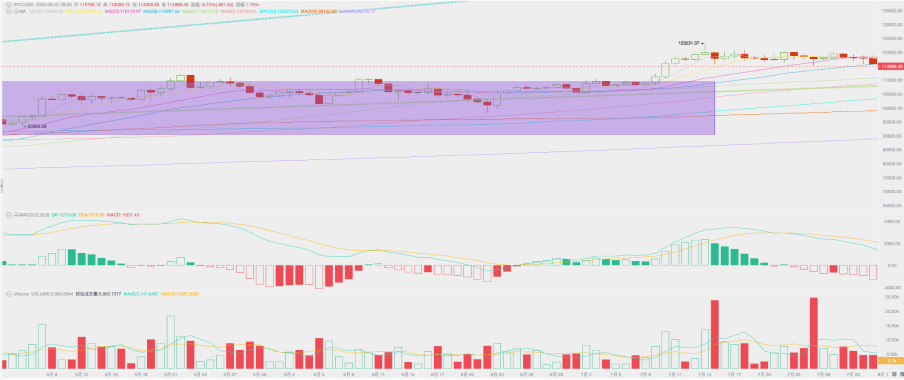
BTC price daily chart.
In the June report, we pointed out that BTC oscillated at the 'Trump floor' (purple area in the above chart) for eight months, with sufficient turnover. Q3 has the conditions to initiate the fourth wave of the market. The market successfully broke through this area in July and continued to surge within a few trading days. However, starting in mid-July, with long-term holders, especially ancient whales, selling, compounded by turmoil in the macro-financial environment, BTC prices were unable to sustain the rise and instead began to oscillate and consolidate again.
From a technical perspective, BTC remains above the 60-day moving average and the first bullish rising trend line (green dotted line in the above chart), with monthly trading volume increasing, indicating it is in a new upward continuation.
From a monthly cycle perspective, the MACD fast and slow lines are still in the expansion phase, indicating that the market remains in a strong upward momentum.
In terms of contracts, the position size continued to rise from the beginning to the end of the month, showing strong market bullish sentiment, but starting from the latter half of the month, both position size and funding rates showed a significant decline, with a certain scale of leveraged funds choosing to exit to avoid risks in the context of increased uncertainty.
Another significant event in July was the apparent restart of Altseason within the cryptocurrency market. Driven by strong corporate purchases, ETH surged 48.8% in a single month, with the ETH/BTC trading pair breaking through technical resistance. We believe that as interest rate cuts approach and risk appetite increases, the reopening of Altseason is highly likely.
Chip structure: Long-term holders initiated the third round of selling.
With the buying power arriving in July, long-term holders initiated the third wave of selling in this bull market.
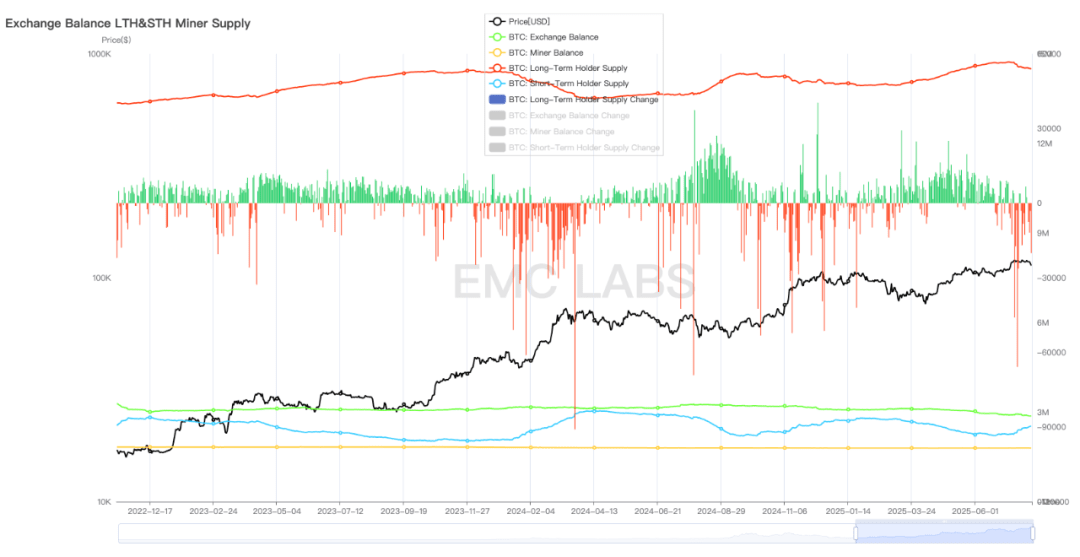
Long and short positions and changes.
According to eMerge Engine data, long-term holders reduced their holdings by nearly 200,000 BTC in July, including 80,000 from a wallet that was created in the Satoshi Nakamoto era. Correspondingly, short positions also rose rapidly.
BTC has flowed from long-term holders into short-term hands, increasing the market's short-term liquidity and creating price pressure. However, it can be seen that the short-term selling by ancient whales has much less impact on market prices compared to the past, indicating that with changes in market participation structure, market depth has significantly increased.
Centralized exchanges continue to see outflows of BTC (over 40,000), indicating that institutional purchases are ongoing. Institutional allocations are the direct driving force behind the price increase of BTC in this bull market.
By the end of July, publicly listed companies directly holding BTC had exceeded 4.5% of the total supply.
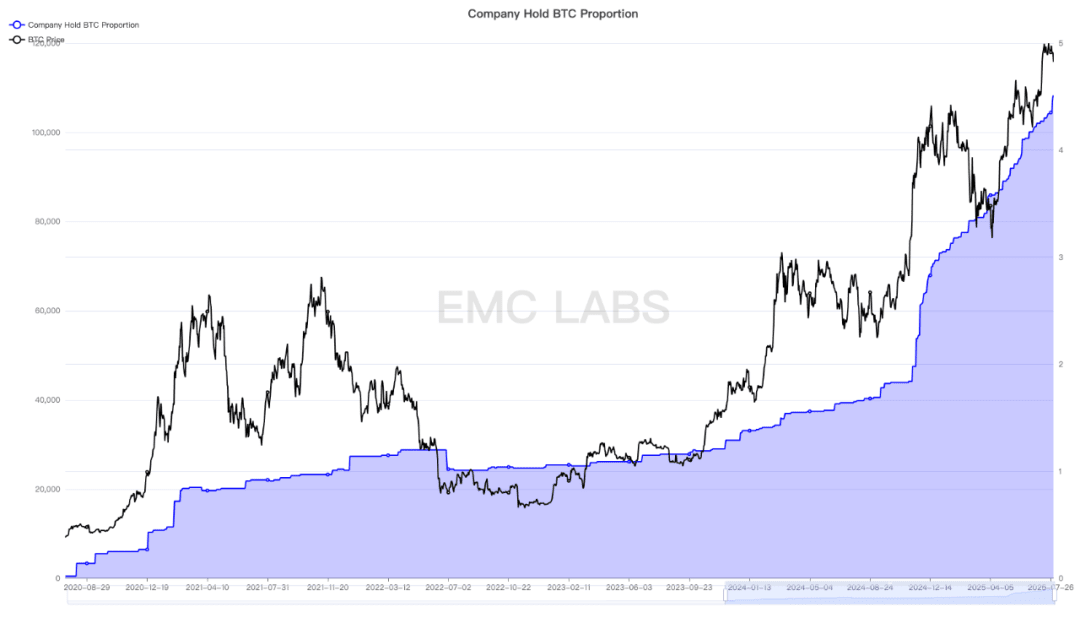
Statistics on company holdings of BTC.
Since the beginning of this year, the scale of direct purchases of BTC by publicly listed companies and other institutions has exceeded that of the BTC Spot ETF channel, officially making it the largest buyer in the BTC market.
Capital flow: Over $29.5 billion inflow, making it the second-largest month in history.
A total of over $29.5 billion flowed into the cryptocurrency market this month, including $12 billion in stablecoins, $11.3 billion in BTC + ETH Spot ETFs, and $6.2 billion in corporate purchases. Corporate purchases are the single largest source of buying power in the BTC market that can be statistically counted.
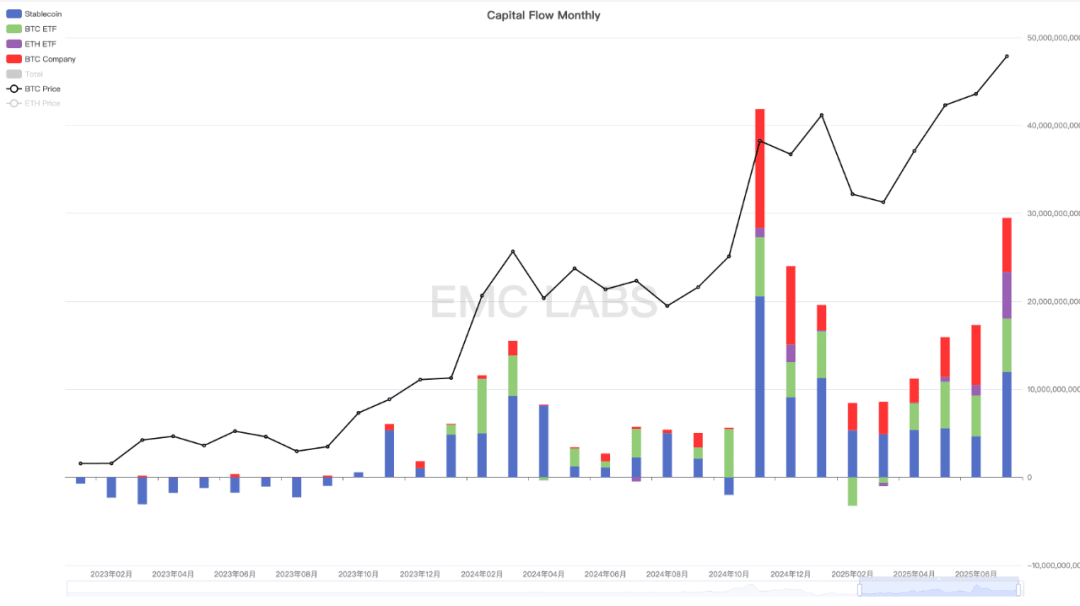
Monthly statistics on capital flows in the cryptocurrency market.
The total inflow of $29.5 billion made July the second-largest inflow month in history, providing material support for BTC to break through a long-standing consolidation area and absorb massive selling pressure to push prices to new historical highs.
It is worth noting that total capital inflows have increased for five consecutive months, driving BTC to continue rising from the six-month low set in April and reaching new historical highs.
The allocation of U.S. companies to BTC continues to accelerate, with more and more companies joining, and this is expected to remain the most important factor driving price increases in the near future.
Additionally, the inflow of funds into the ETH Spot ETF reached $5.298 billion this month, marking the highest month in history, approaching the $6.061 billion of the BTC Spot ETF channel. This is accompanied by the approach of interest rate cuts and further expansion of cryptocurrency assets in the U.S., leading to an increasing flow of capital to ETH. Meanwhile, the number of companies allocating ETH is also increasing, and by the end of the month, these companies' allocation of ETH accounted for 2.6% of the total circulation, although still lower than BTC's 4.6%, but the growth rate is rapid, and the pricing power of ETH is also shifting from on-exchange to off-exchange.
Conclusion
eMerge Engine shows that the BTC Metric is 0.75, indicating that BTC is in a bull market rising phase.
From a multi-dimensional analysis perspective, BTC is still in the continuation phase of the fourth wave of this bull market, and after fluctuations in August, it is likely to continue rising.
With ETH leading the way, as the interest rate cuts approach, market risk appetite is rising, and Altseason is likely to open.
The tariff war conflict, U.S. inflation, and employment data pose the biggest tail risks.
Continuously pay attention to ILV, SYN, RARE, C, TREE.
