
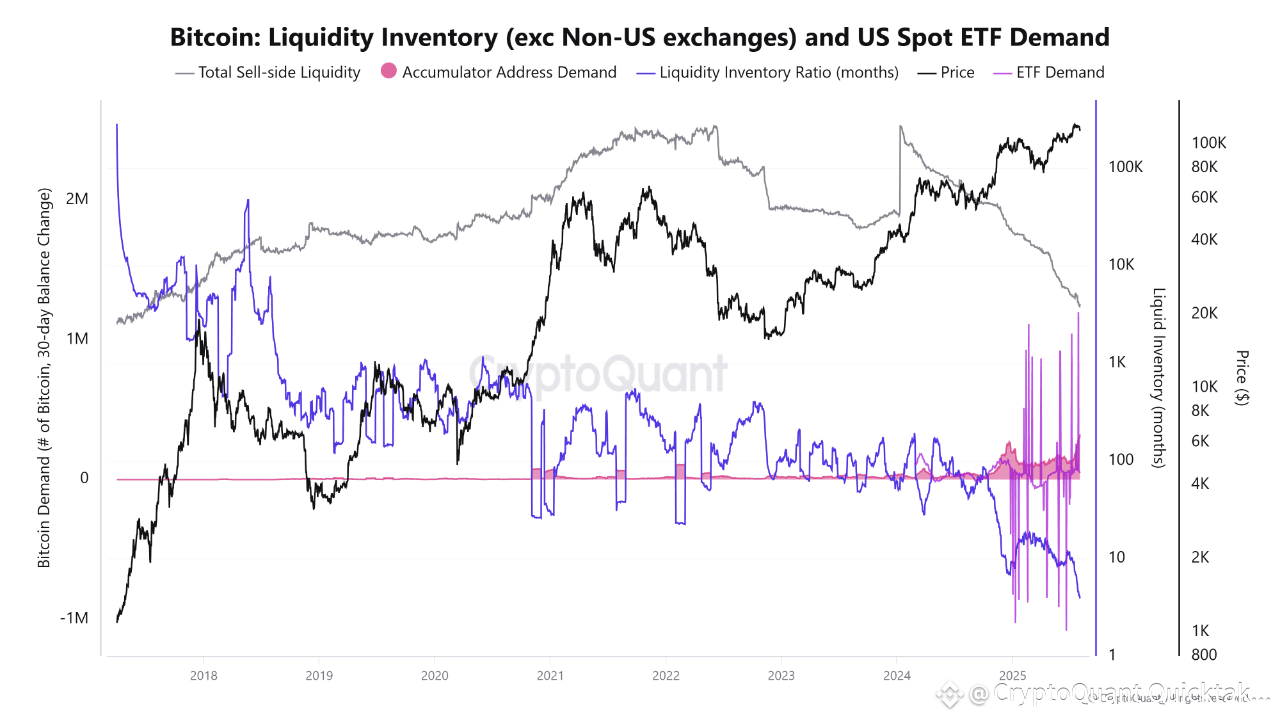
📉 First: The Liquidity Inventory Ratio Collapse
Starting in mid-July, the liquidity ratio (represented by the number of months of liquidity available for sale on the platforms – the blue line) began a rapid collapse, reaching unprecedented levels of just over three months. What does this mean? Technically, this indicator indicates a supply crisis, as the amount of Bitcoin available for sale is declining significantly. In healthy markets, this should lead to a price increase due to scarcity, but the exact opposite happened. In the absence of effective and new buying demand – whether from ETFs or large investors – the market has become fragile, unable to absorb even the smallest sell orders without a price drop.
⚠️ Market fragility in this case is similar to that of "thin" markets, where the lack of liquidity amplifies the impact of any selling movement, no matter how small.
📉Second: Volatility and instability in ETF demand.
We observe sharp and rapid peaks in ETF demand, followed by strong negative spikes. This indicates that ETF inflows were intermittent and not stable during periods when funds were withdrawn from ETFs. There was no alternative demand to compensate for this shortfall. This led to a decline in price support from the largest institutional buyers (ETFs), opening the door to a price decline, especially with weak liquidity.
🌕 Third: Smart portfolio accumulation was limited and weak.
The pink area in the chart (accumulator address demand) shows accumulation by some smart addresses—but its pace was slow and largely steady, without significant buying surges. Although accumulation is generally positive, the slow and limited movement of these addresses was insufficient to create real support during a market weakness. What happened was that there was "latent demand," but it was neither active nor synchronized with the moment of decline, so the market lost its resilience.
Written by Arab Chain
