
Some investors are probably starting to worry given the recent price drop, especially STH who are now either forced to realize losses or hold underwater positions.
To assess whether the situation could worsen significantly, analyzing current demand is essential.
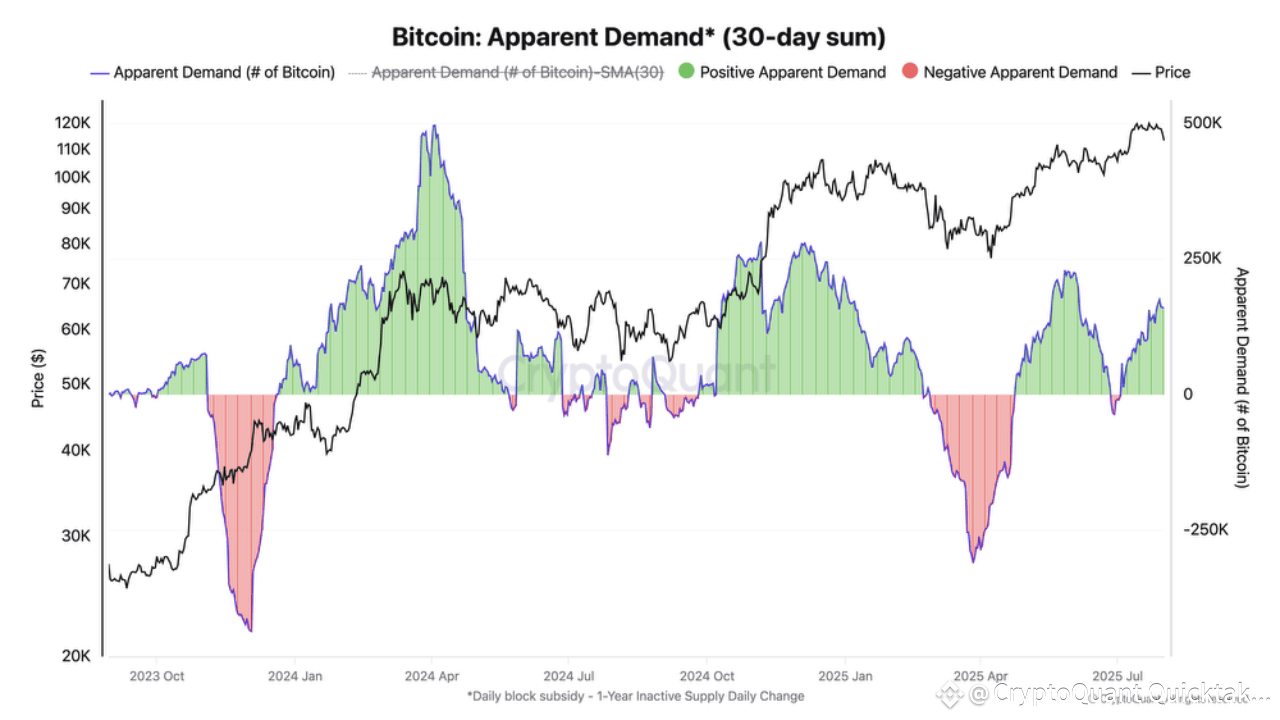
🔹 Apparent demand
This chart compares new BTC issuance to over 1-year inactive supply, highlighting what we call apparent demand.
When the ratio drops below zero, it means demand has turned negative; conversely, when it rises above zero, it signals positive demand.
Currently, demand remains clearly positive, with around 160 000 BTC accumulated over the past 30 days.
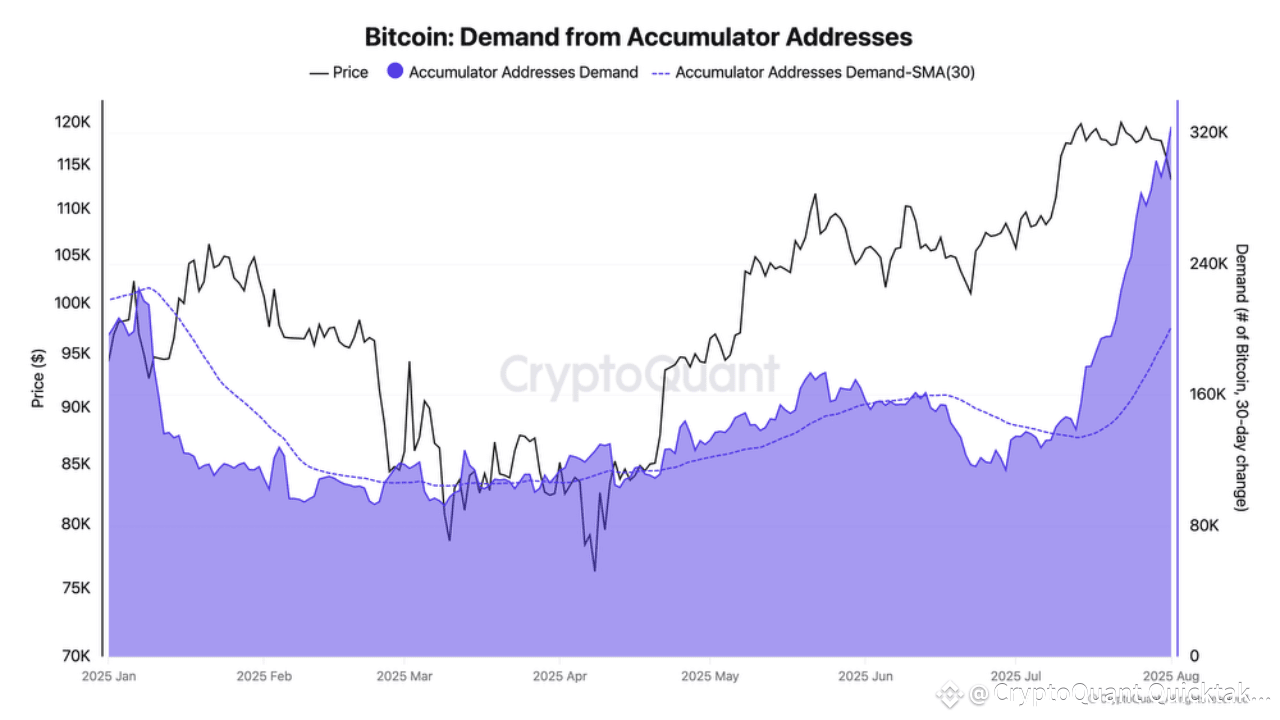
🔹 Demand from accumulator addresses
This metric tracks addresses that have only acquired BTC without selling any, giving us insight into both demand and holding conviction.
Over the past month, the average BTC accumulated by these addresses has increased by roughly 50 000 BTC, showing strong and sustained buying behavior.
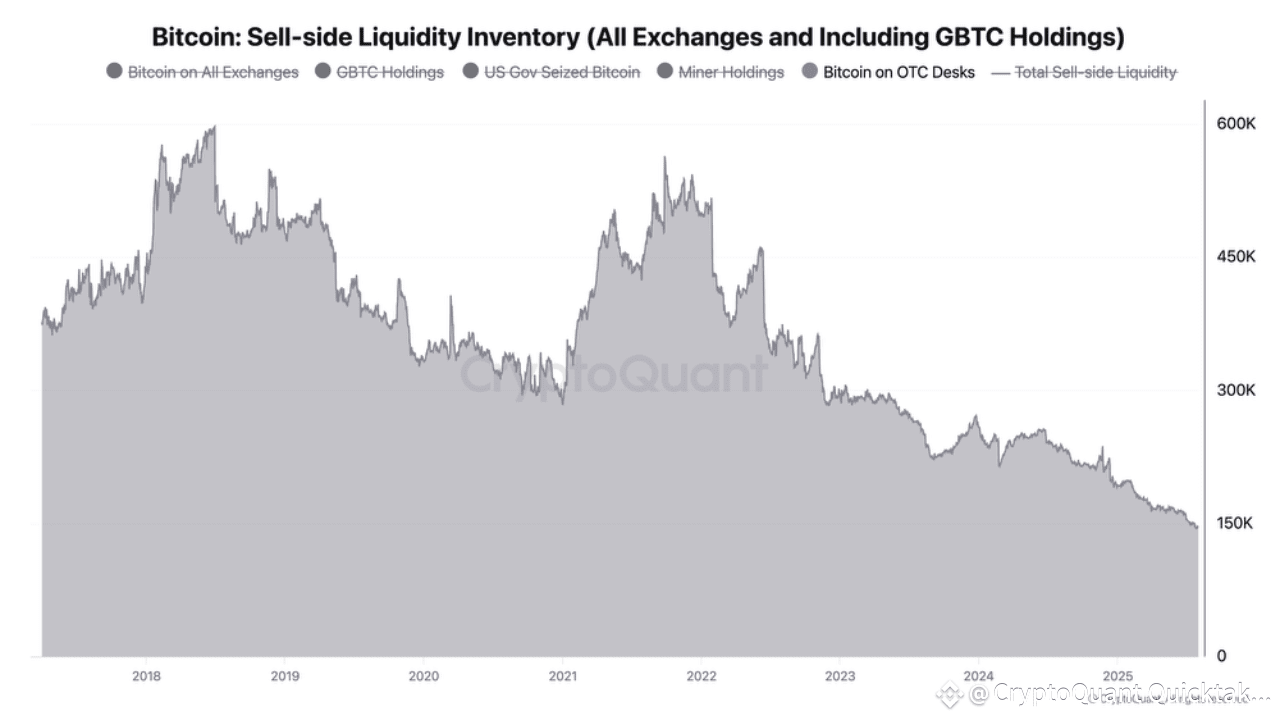
🔹 BTC on OTC Desks
This is a more long-term view, reflecting a different type of demand, one that is off-chain and has limited short-term price impact.
The BTC held by OTC desks has been declining significantly, in September 2021, there were about 550 000 BTC available, compared to just 145 000 BTC today.
Whether we look at short-term or long-term demand, the picture remains broadly positive.
There is no major sign of concern from demand-side indicators, despite recent price volatility.
Written by Darkfost
