The full analysis of the PEPE/USDC trading pair in the Binance screenshot you provided is listed below:
🔹 Currency pair: PEPE/USDC
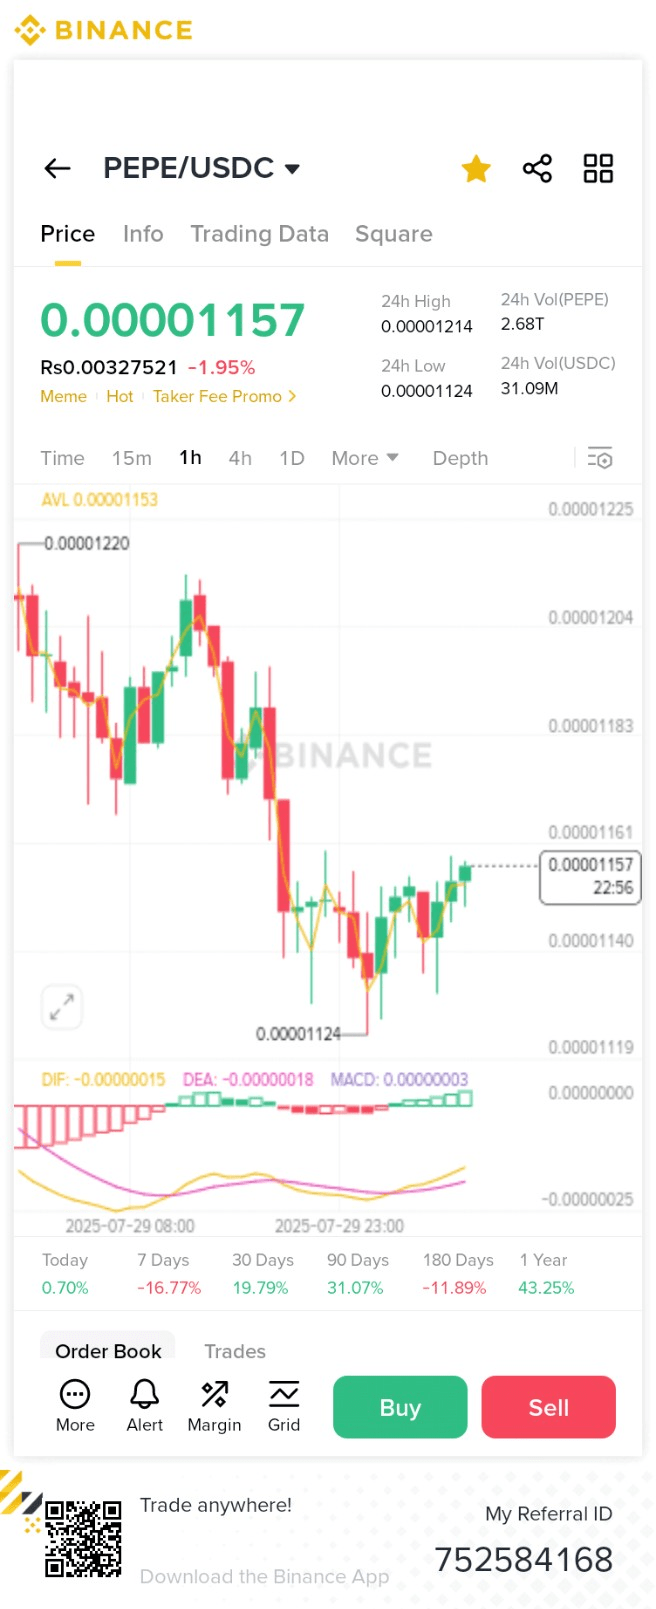
This pair is showing the PEPE meme coin against USDC (a stablecoin).
📊 Price details:
Current price: 0.00001157 USDC
In Pakistani Rupees: Rs. 0.00327521
Change (in 24 hours): -1.95% (price has decreased)
📈 24-hour limit:
High price: 0.00001214
Lowest price (Low): 0.00001124
📊 Chart analysis (1 hour chart):
The chart shows a reversal after the price dropped to a lower low at 0.00001124.
The current price is 0.00001157, which is showing some improvement.
Small candles and consolidation indicate that the market is not yet able to make a decision, but buying interest is increasing slightly.
🟪 MACD Indicator:
DIF: -0.00000015
DEA: -0.00000018
MACD Histogram: 0.00000003
➡️ This indicates that the market is trying to move from bottom to top, MACD is improving.
📆 Historical performance:
Today: +0.70%
7 days: -16.77% ❌
30 days: +19.79% ✅
90 days: +31.07% ✅
180 days: -11.89% ❌
1 year: +43.25% ✅
➡️ The market is positive in the long term (1 year, 90 days), but has been under pressure in the recent week.
📌 Main levels:
Entry Point (Possible): 0.00001150 – 0.00001157 (around the current price)
Stop Loss: Place it below 0.00001124 (as this is the recent low)
Take Profit Targets:
TP1: 0.00001183
TP2: 0.00001214
TP3: 0.00001225 (Resistance zone)
🔔 Prescription: (Not Financial Advice)
If you want to trade short-term:
Buy zone: Current level (0.00001157)
Stop Loss: 0.00001120
Target: 0.00001183 to 0.00001225
But if the market goes below 0.00001124 again, the chances of a downtrend will be higher.
If you need a trading plan in Urdu, more guides, or analysis with pictures, let me know.